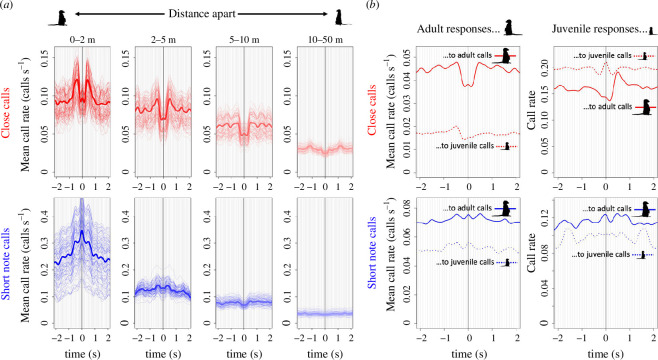
Figure 4.
Call–response dynamics in space and time ( a ) and as a function of the individual age ( b ) for close calls (top row, red) and short note calls (bottom row, blue). ( a ) Mean call rate of potential responders relative to a call by a focal caller, as a function of the distance between caller and potential responder (panels) and time relative to the focal call (x-axis). Thick lines show mean call rates (per second) taken across all groups and all days. Thin lines show bootstrapped replicates where days were randomly sampled with replacement, taking the same number of days per group as in the full dataset. ( b ) Mean call rate of potential responders relative to a focal call, as a function of the age class of both focal caller and potential responder.

