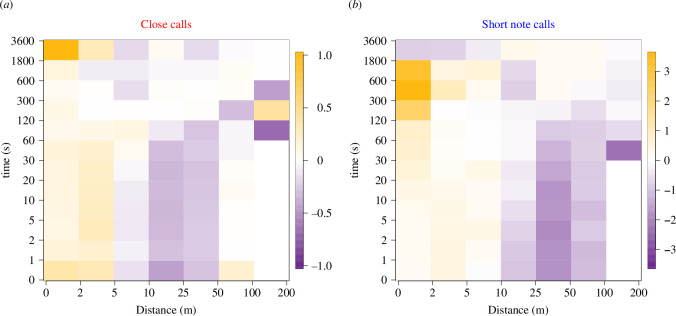
Figure 5.
Comparison of call clustering to null expectations based on meerkat positions for close calls (a) and short note calls (b). Colour represents the log ratio of the observed level of clustering to the expected level of clustering at a given distance (x-axis) and temporal (y-axis) scale. Orange regions indicate spatial and temporal scales for which pairs of calls are found more often than expected, purple regions show where they are found less often than expected, and white regions show where they are found as often as expected, relative to the distribution of meerkats. Note that all call pairs are considered in the analysis, not solely consecutively produced calls, in order to measure the persistence of call clustering at an aggregate level. Overall, both types of calls tend to be clustered at short spatial scales (up to ~5–10 m). The temporal persistence of the clustering of calls is relatively long, lasting at least 30 min. Note the different colour scales for the two panels, indicating overall greater effects (relative to null expectations) for short note calls than for close calls.

