
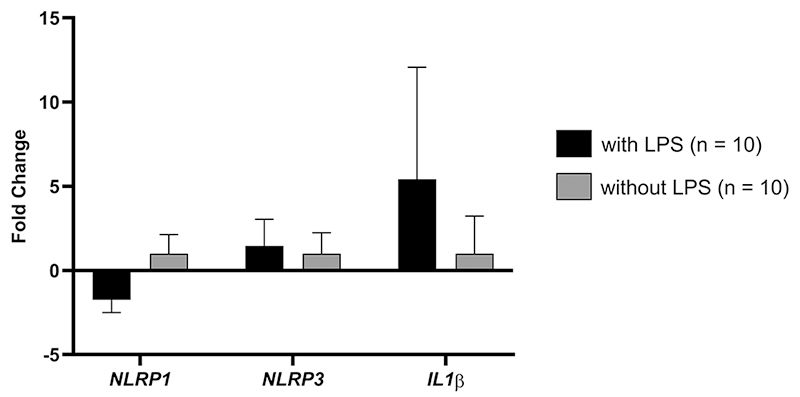
Figure 2 - . Expression profile of NLRP1 (p=0.1879), NLRP3 (p=0.5889) and IL1β (p=0.0075) genes in PBMCs from individuals with DS with and without LPS stimulation.
Official websites use .gov
A
.gov website belongs to an official
government organization in the United States.
Secure .gov websites use HTTPS
A lock (
) or https:// means you've safely
connected to the .gov website. Share sensitive
information only on official, secure websites.