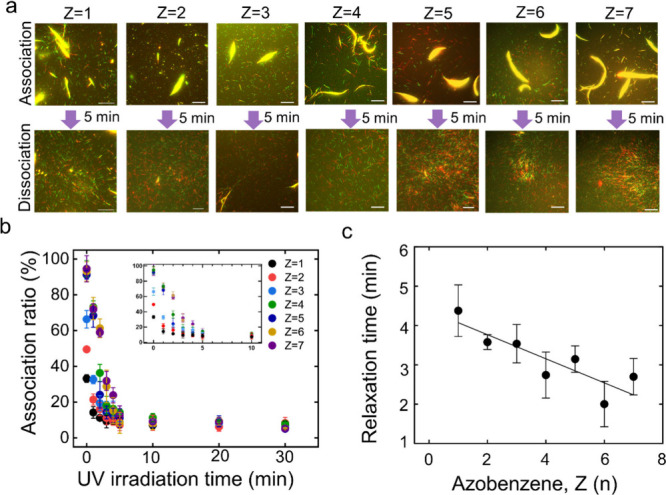
Figure 2.

Effect of the number of azobenzenes on the dissociation of the MT swarm. a. Fluorescence microscopy images showing the dissociation of the MT swarms upon varying the number of azobenzene, Z (n) in T12(TTG)(n+1)Z(n) DNA after 5 min of UV irradiation. The intensity of UV light is 0.6 mW/cm2. The association images were captured after 60 min of VIS light irradiation. The labeling ratio of DNA to MT was maintained the same. Scale bar: 20 μm. b. Change in the association ratio of the MTs with the UV irradiation time in which MTs were modified with different numbers of azobenzene-incorporated DNA. Error bar: standard deviation. The inset shows the enlarged association ratio from 0 to 10 min. c. Change in the relaxation time (τ) of MT dissociation from the swarm under UV irradiation with the number of azobenzenes, Z (n) in DNA. Relaxation time was measured from the fitted curve of Figure 2b; the data were fitted with Y = (Y0 - Plateau)*exp(-K*X) + Plateau, where K is the rate constant). Relaxation time is the characteristic time for dissociation, which is computed as the reciprocal of the rate constant. The best fit line has a slope of −0.31 ± 0.08 and a goodness of fit of R2 = 0.82. (Y0 – Plateau), the amplitude of the exponential decay is found to increase with the Azobenzene number of DNA.
