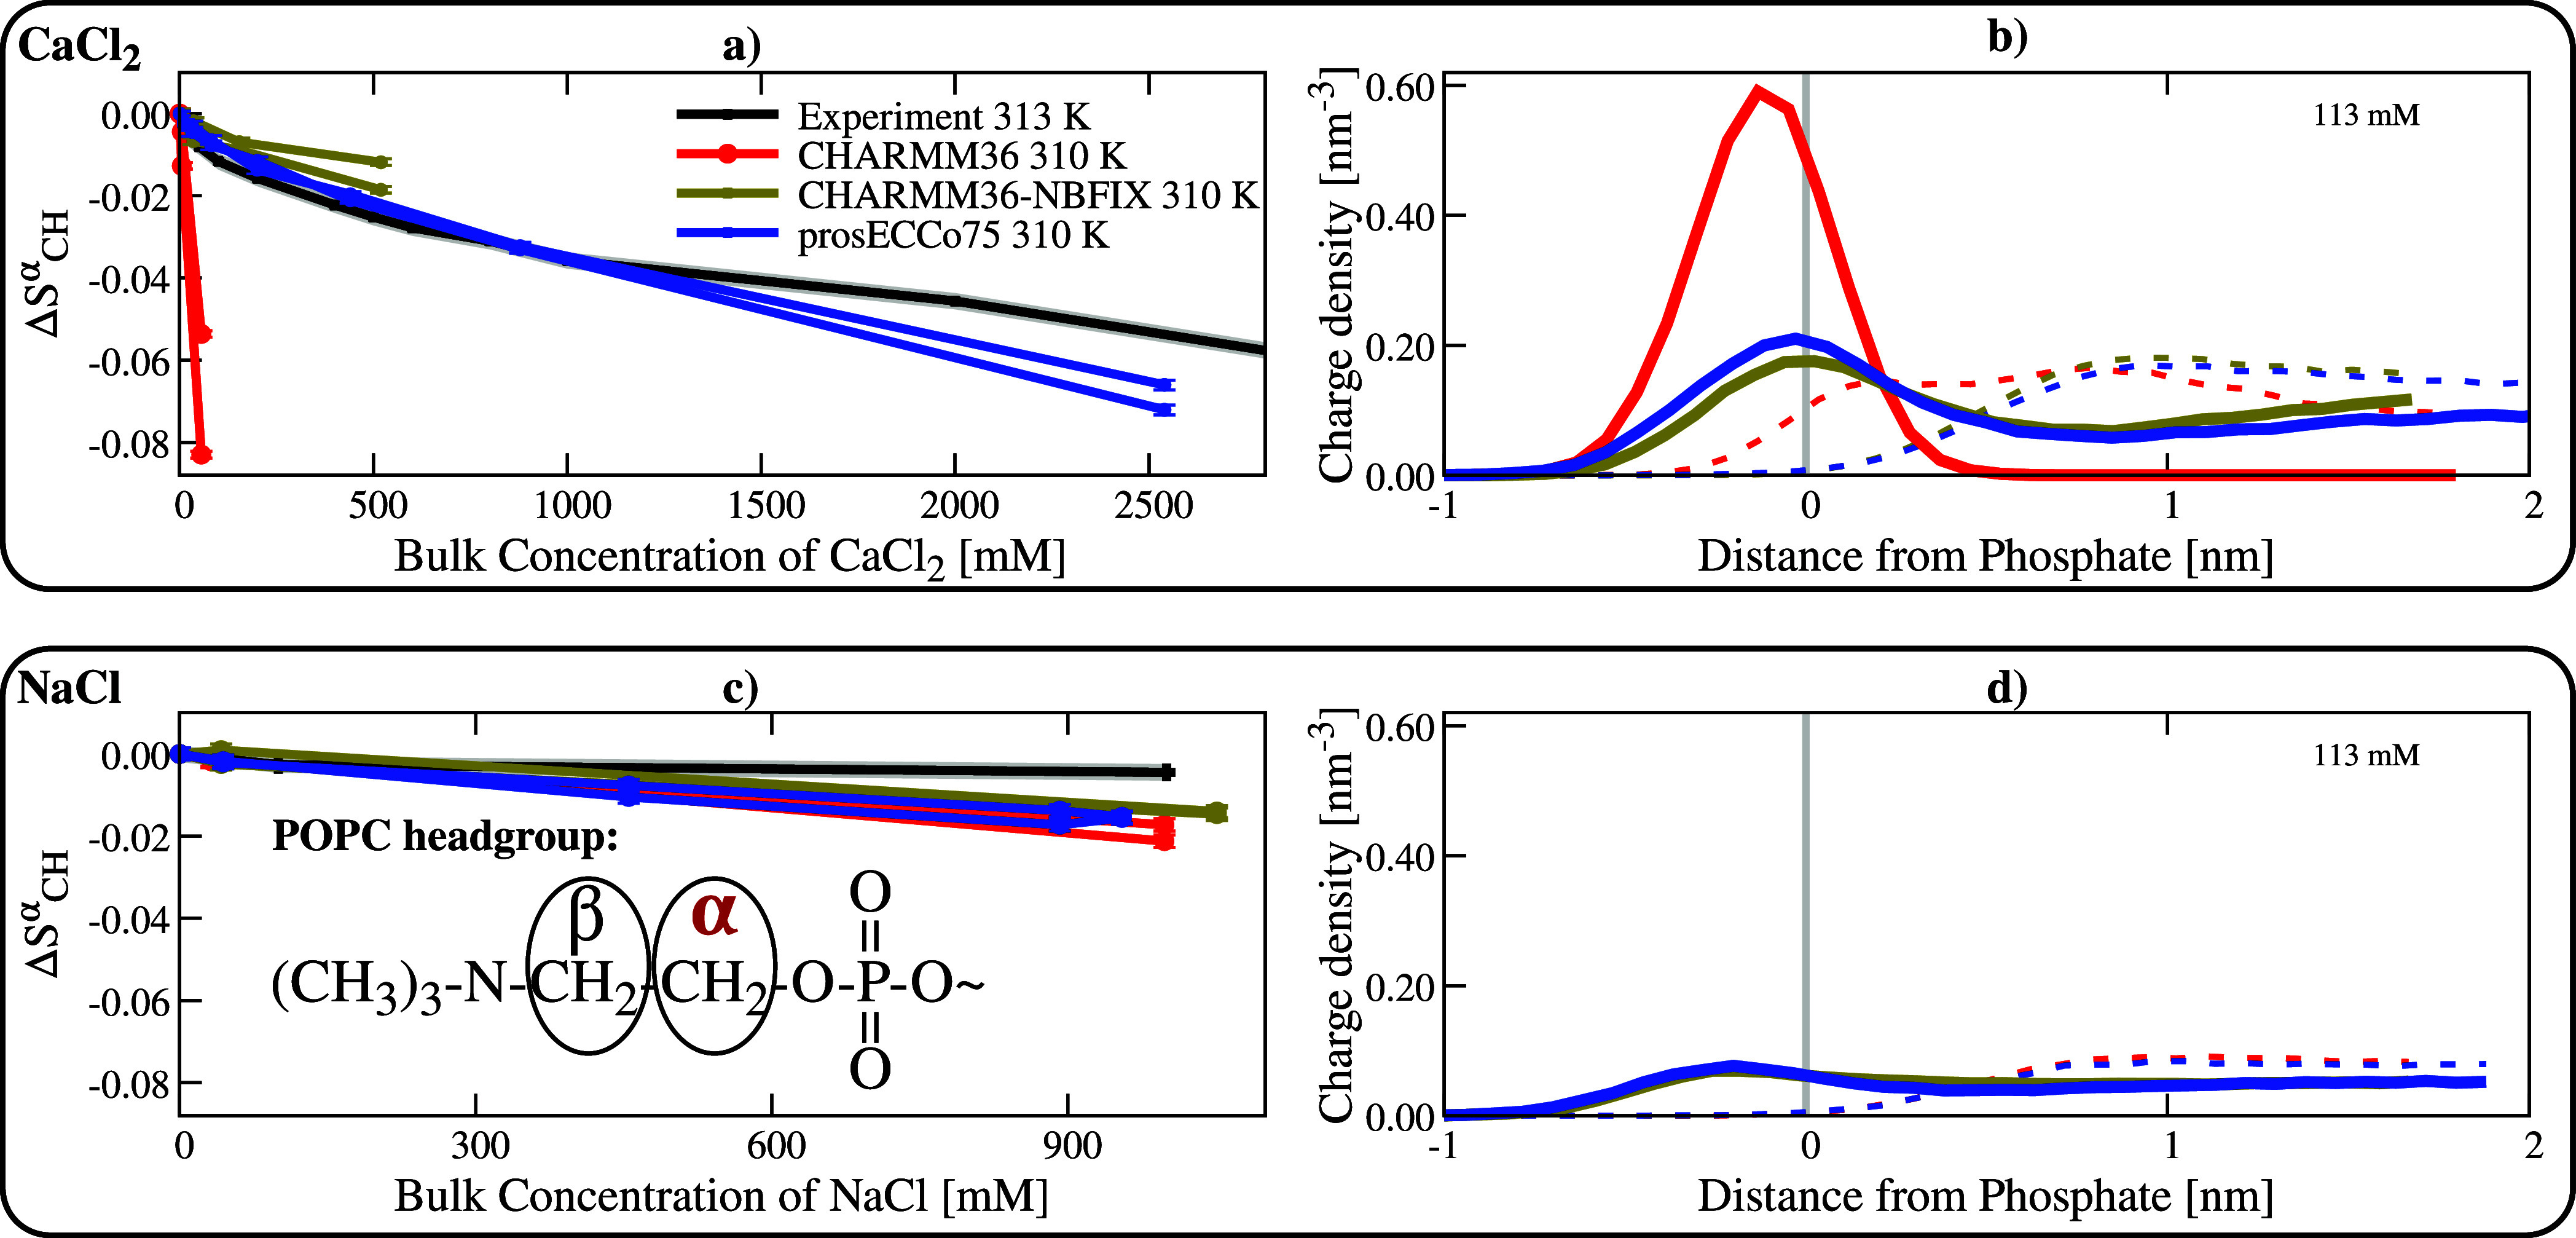
Figure 2.

Binding of Ca2+ and Na+ ions to POPC membranes. Top panel: Ca2+ ions. Bottom panel: Na+ ions. Panels (a,c) show the order parameter response on the α position of POPC lipids as a function of bulk salt concentration. Duplicated simulation lines correspond to two different order parameter signals of the α C–H bonds. Experiments are from ref (82). Panels (b,d): Charge density profiles of Ca2+ and Na+ ions calculated from MD simulations (shown by solid lines), as well as the Cl– counterions (dashed lines), are shown for the three different models. All the density profiles are calculated along the membrane normal and centered around the maximum density of the lipid phosphorus atoms (vertical gray line). The simulation error bars are smaller than the size of the markers.
