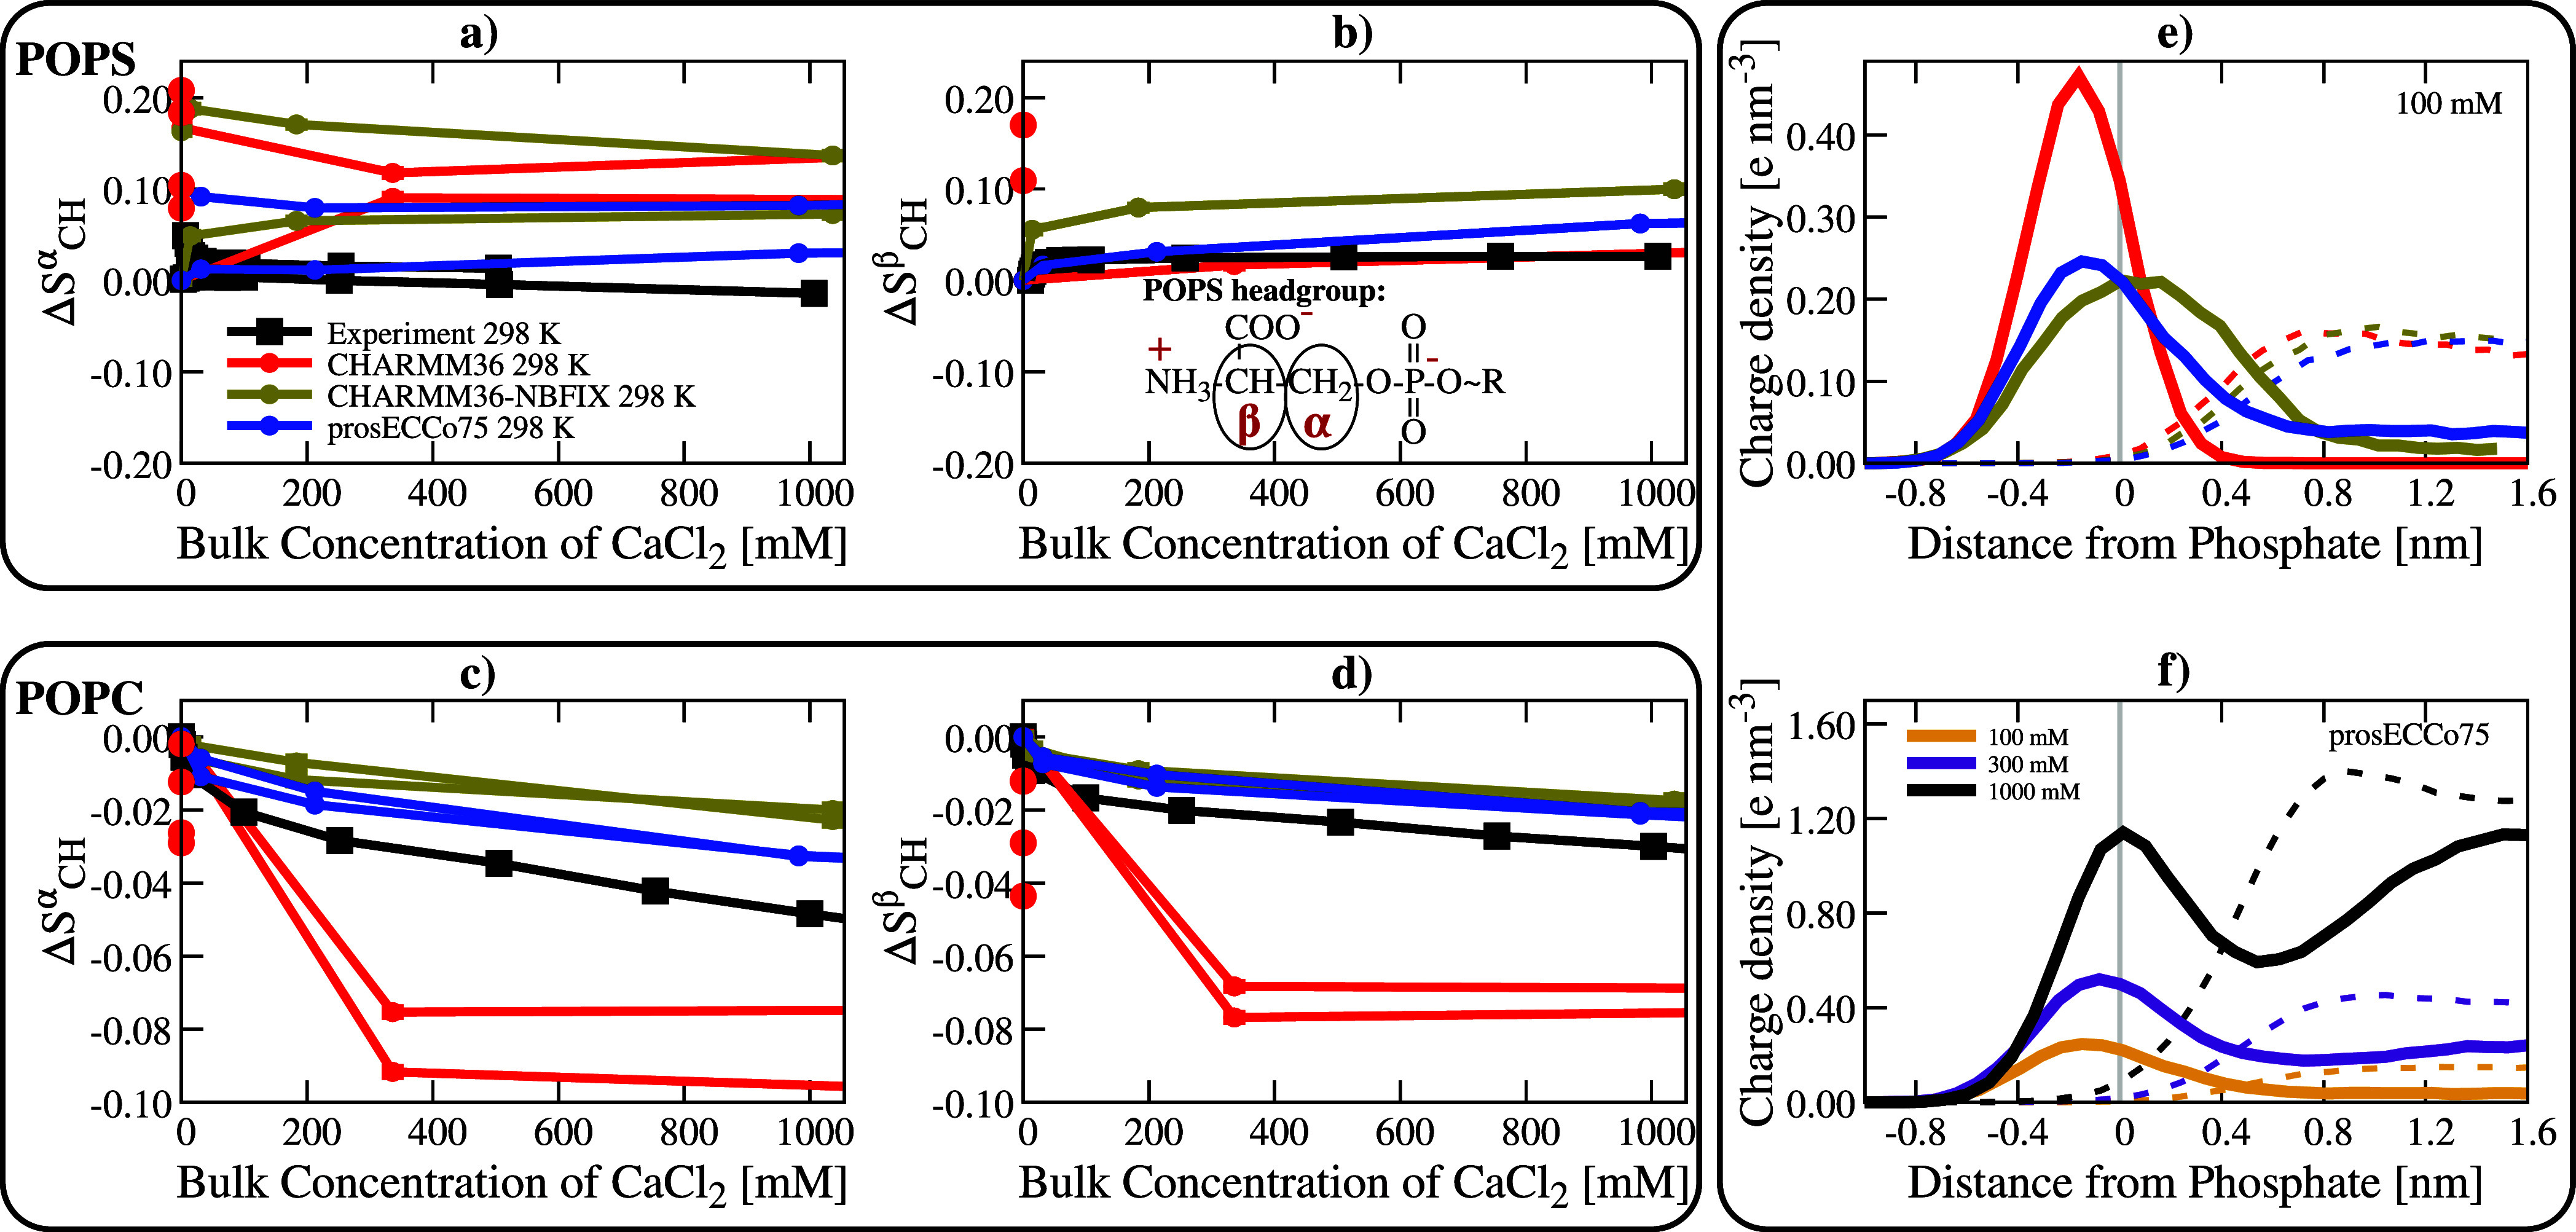
Figure 4.

Binding of Ca2+ ions to 5:1 POPC:POPS mixture membranes. Panels (a,b): behavior of POPS in the mixture. Panels (c,d): behavior of POPC in the mixture. All these panels show the order parameter response in a lipid bilayer as a function of the bulk concentration of Ca2+ in the system. Duplicated simulation lines correspond to two different order parameter signals of the α C–H bonds. Panel (e) compares the calcium charge density profiles centered around maximum phosphate density for the three force fields and panel (f) shows the calcium charge density profiles of prosECCo75 model at three different concentrations. Charge density profiles of Ca2+ shown by solid lines and Cl– counterions with dashed lines. Na+ was used to neutralize POPS charges. Experimental data are from ref (91). In the case of CHARMM36, the multiple points at a bulk concentration of 0 mM result from all Ca2+ ions being bound to the lipids in several systems with different total numbers of Ca2+ per system.
