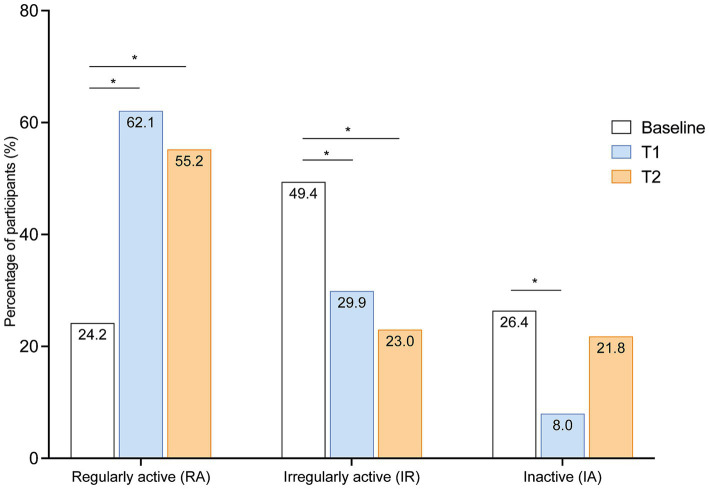
Figure 3.
Changes of physical activity levels at short-term and long-term in comparison to baseline. Percentage of different activity levels of pwMS (n = 87) at short- (T1) and long-term (T2) after completing the program in comparison to baseline. Bars show percentage. Statistical analysis was performed by McNemar Test; *p < 0.05.

