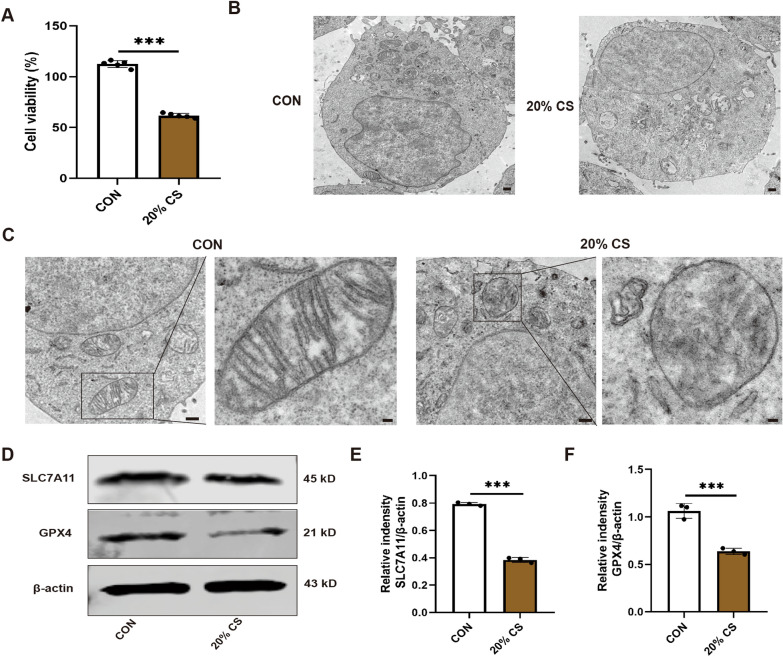
Fig. 4.
Overstretching of MLE12 cell activated cell injury and ferroptosis. A Cell viability of CS-MLE12 cells as observed using CCK8 assays (n = 5). B Representative transmission electron microscopy (TEM) images of MLE12 cells untreated or treated with 20% CS. Magnification: 1200 × , acceleration voltage: 80 kV. Scale bar: 5.0 μm. C Representative TEM images of the lung tissue sections. Magnification: 1200 × and acceleration voltage: 80 kV. Scale bar: 5.0 μm. Amplified pictures of mitochondria are labeled using black boxes, and the indicated area is shown at 6000 × magnification. Scale bar: 1.0 μm. D Representative western blots of SLC7A11, GPX4, and β-actin in MLE12 cells. E, F Relative protein expression of SLC7A11 and GPX4 was normalized to β-actin (n = 3). Data are expressed as mean ± standard deviation. “*” indicates a significant difference between the corresponding groups (*p < 0.05, **p < 0.01, or ***p < 0.001)

