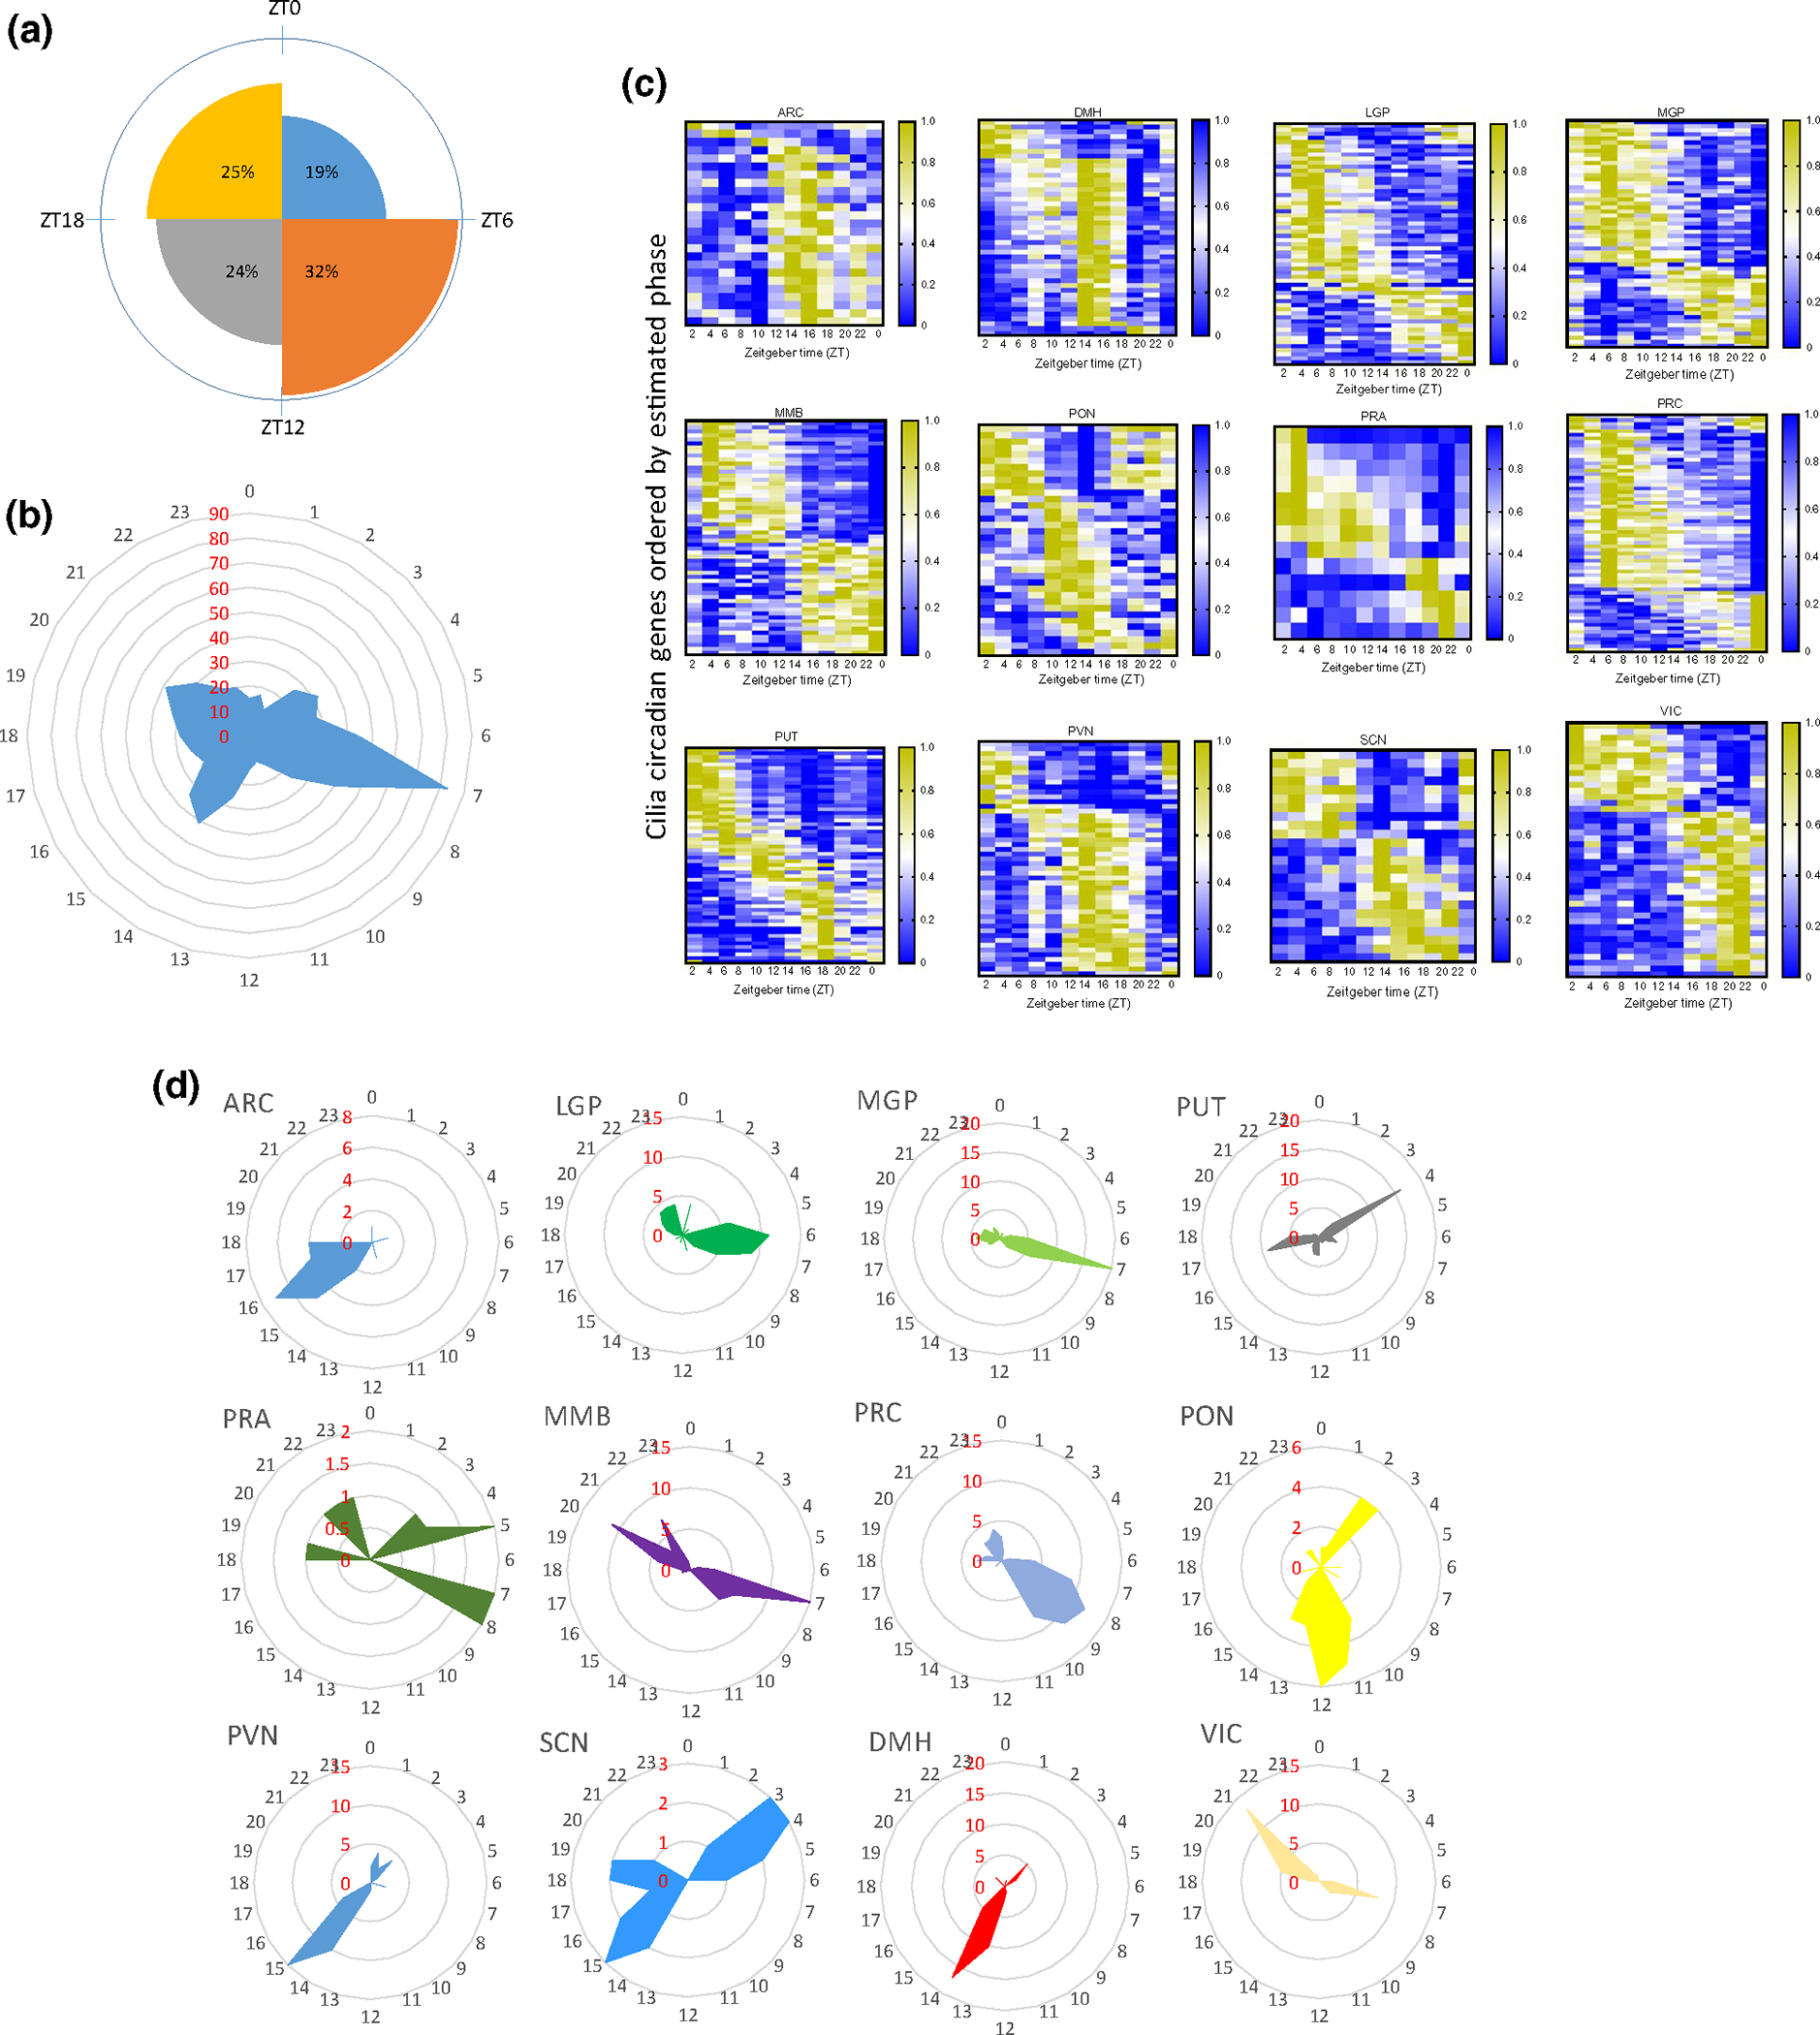
FIGURE 2.

Cilia circadian gene display region-specific expression. (a) Rose diagram showing the percentage of cilia circadian genes in each of the four time phases. (b) Radial diagram of the distribution of the peak phase of expression of the circadian cilia genes in the whole brain. The radial plot displays phases (hr) on the circumference and the number of gene peaks of expression on the radius (red). (c) Heatmap representation of 24-hr oscillation of circadian cilia genes in the 12 brain regions that exhibited overrepresented circadian cilia genes in primate brain (p < 0.05), with mean expressions ordered by phase (p < 0.05). Gene expressions are normalized between 0 and 1, yellow (1) indicates a peak of expression and blue (0) indicates a trough of expression. (d) Radial plot of the distribution of the peak phase of expression of the cilia circadian genes in each of the 12 brain regions that exhibited overrepresentation (in Figure 1d). Phases (hours) are displayed on the circumference and the numbers of gene peaks of expression are displayed on the radius (red)
