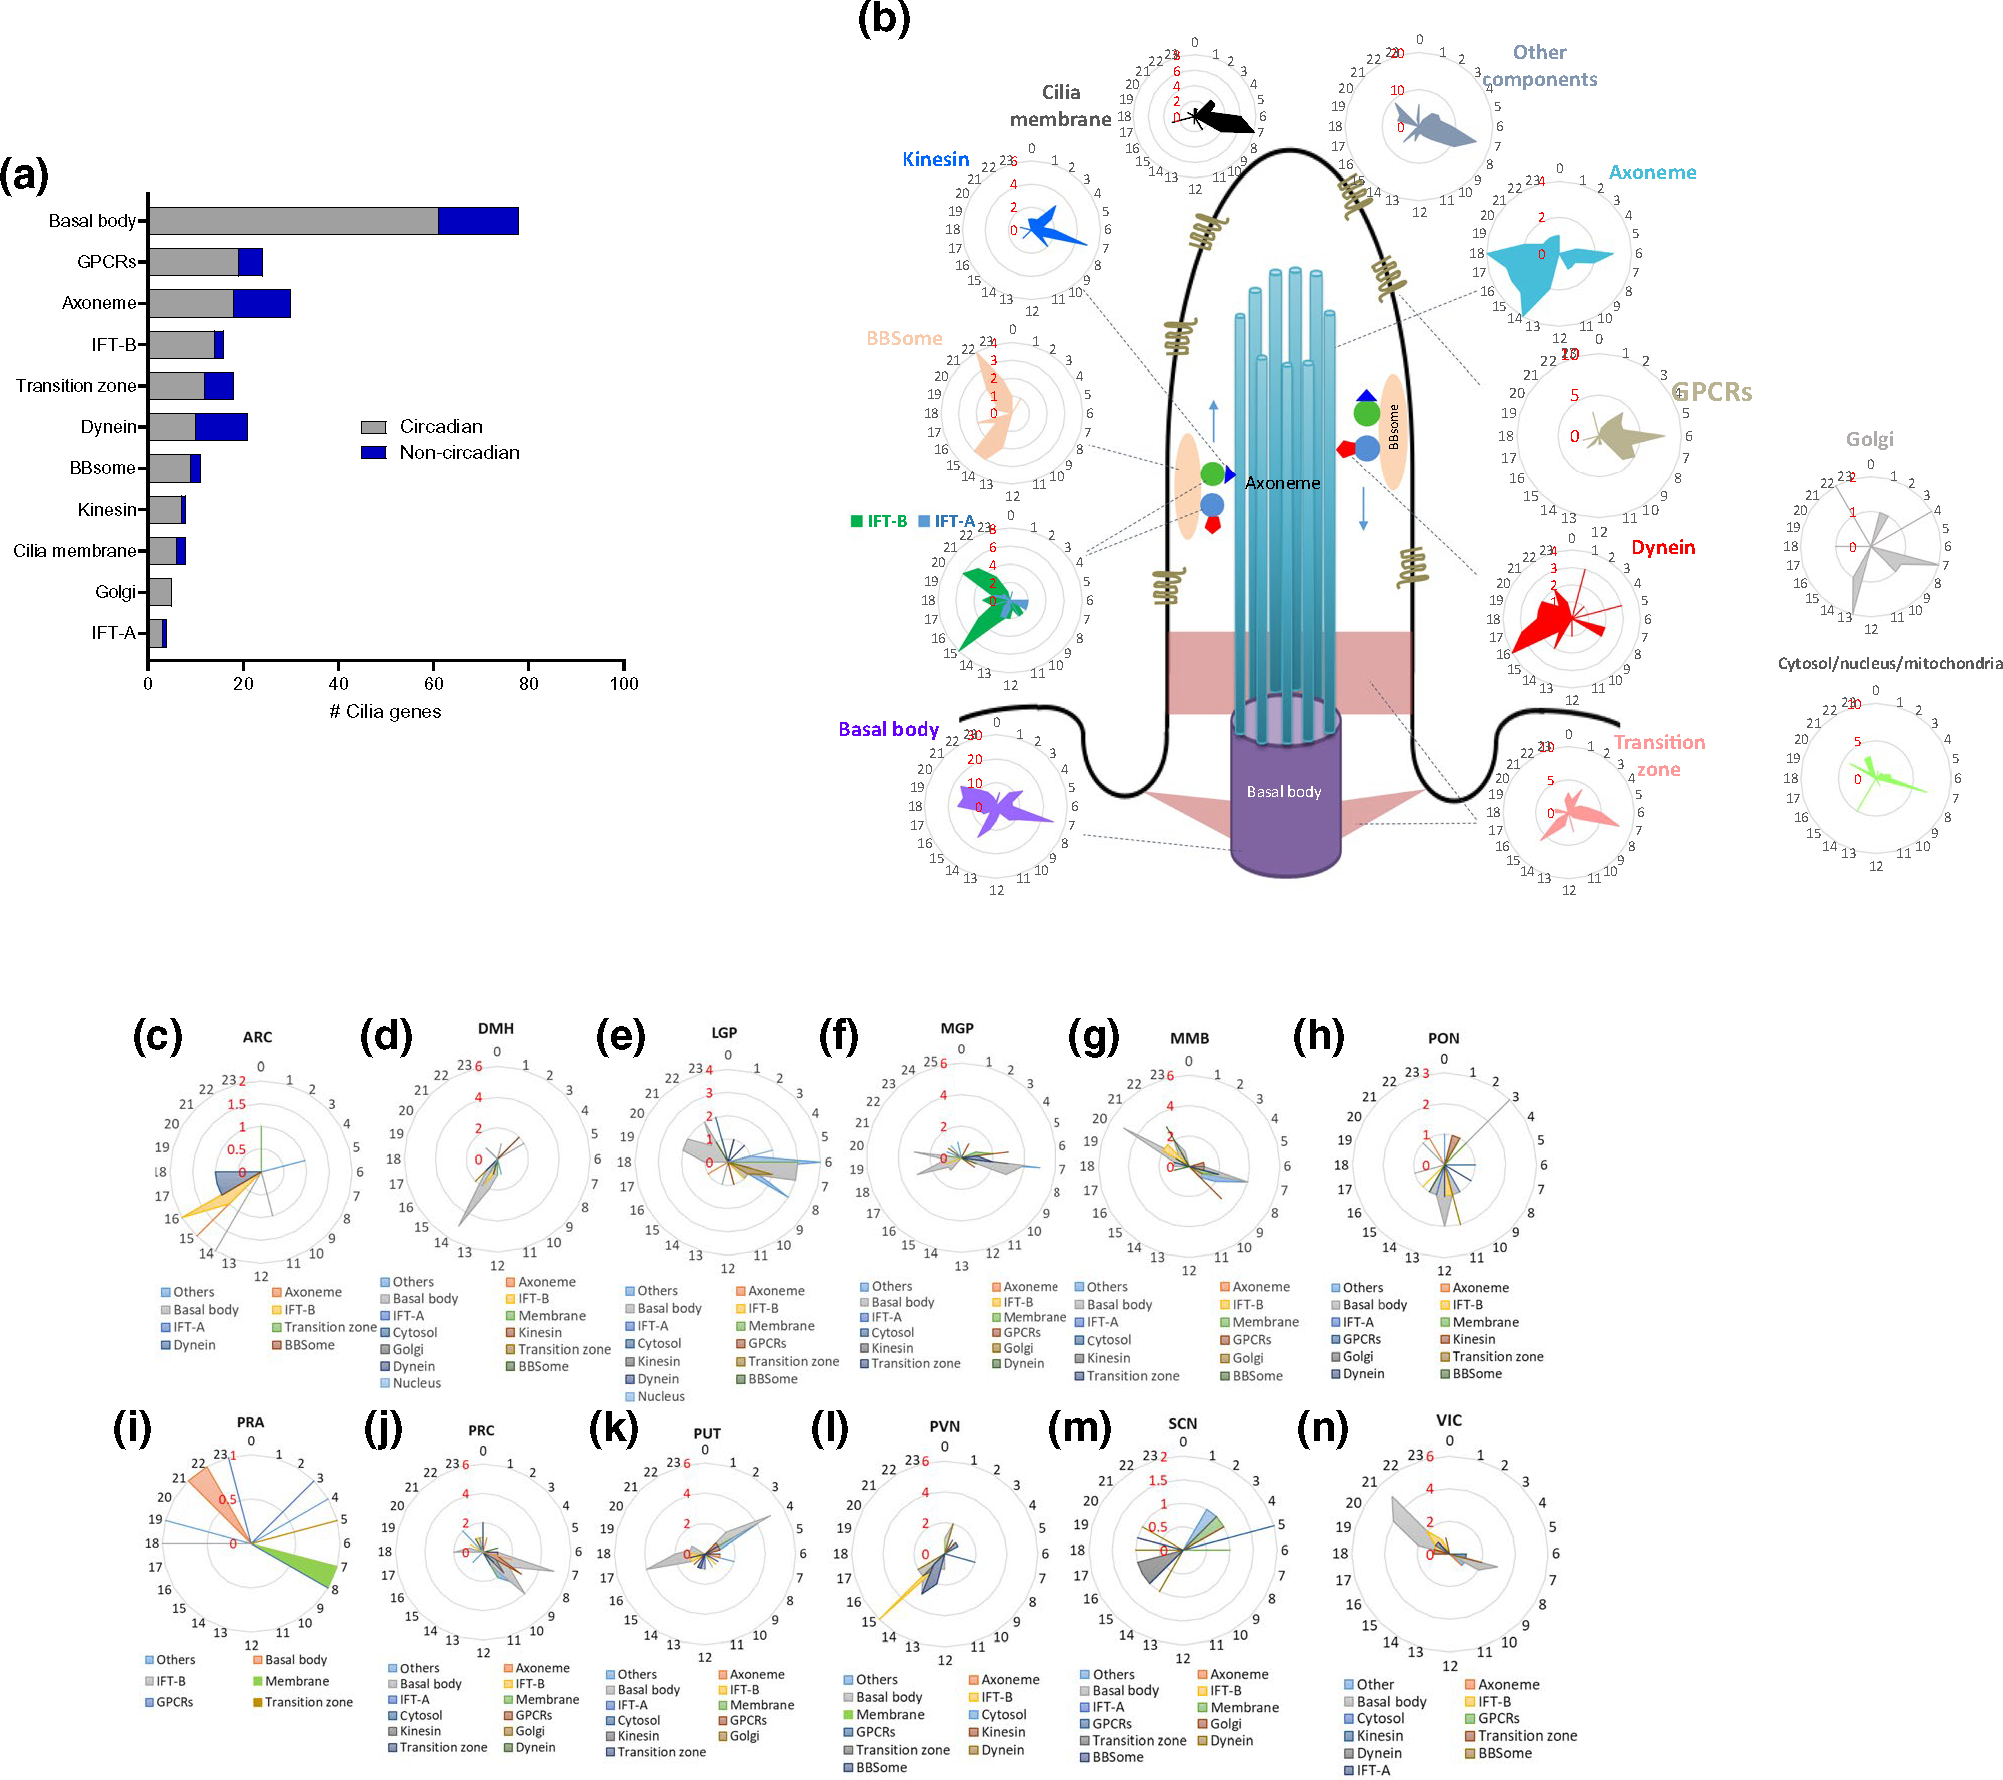
FIGURE 4.

Substructural organization of cilia circadian genes. (a) Number of circadian and non-circadian genes in each of cilia substructural compartments. (b) Schematic of cilia structure and radial diagrams of the distribution of the peak phase of expression of the cilia substructural components’ transcripts in the whole brain. The radial plot displays phases (hours) on the circumference and the number of gene peaks of expression on the radius (in red). (c–n) Radial diagram of the distribution of the peak phase of expression of the circadian cilia genes in the 12 brain regions that showed significant enrichment. The radial plot displays phases (hours) on the circumference and the number of gene peaks of expression on the radius
