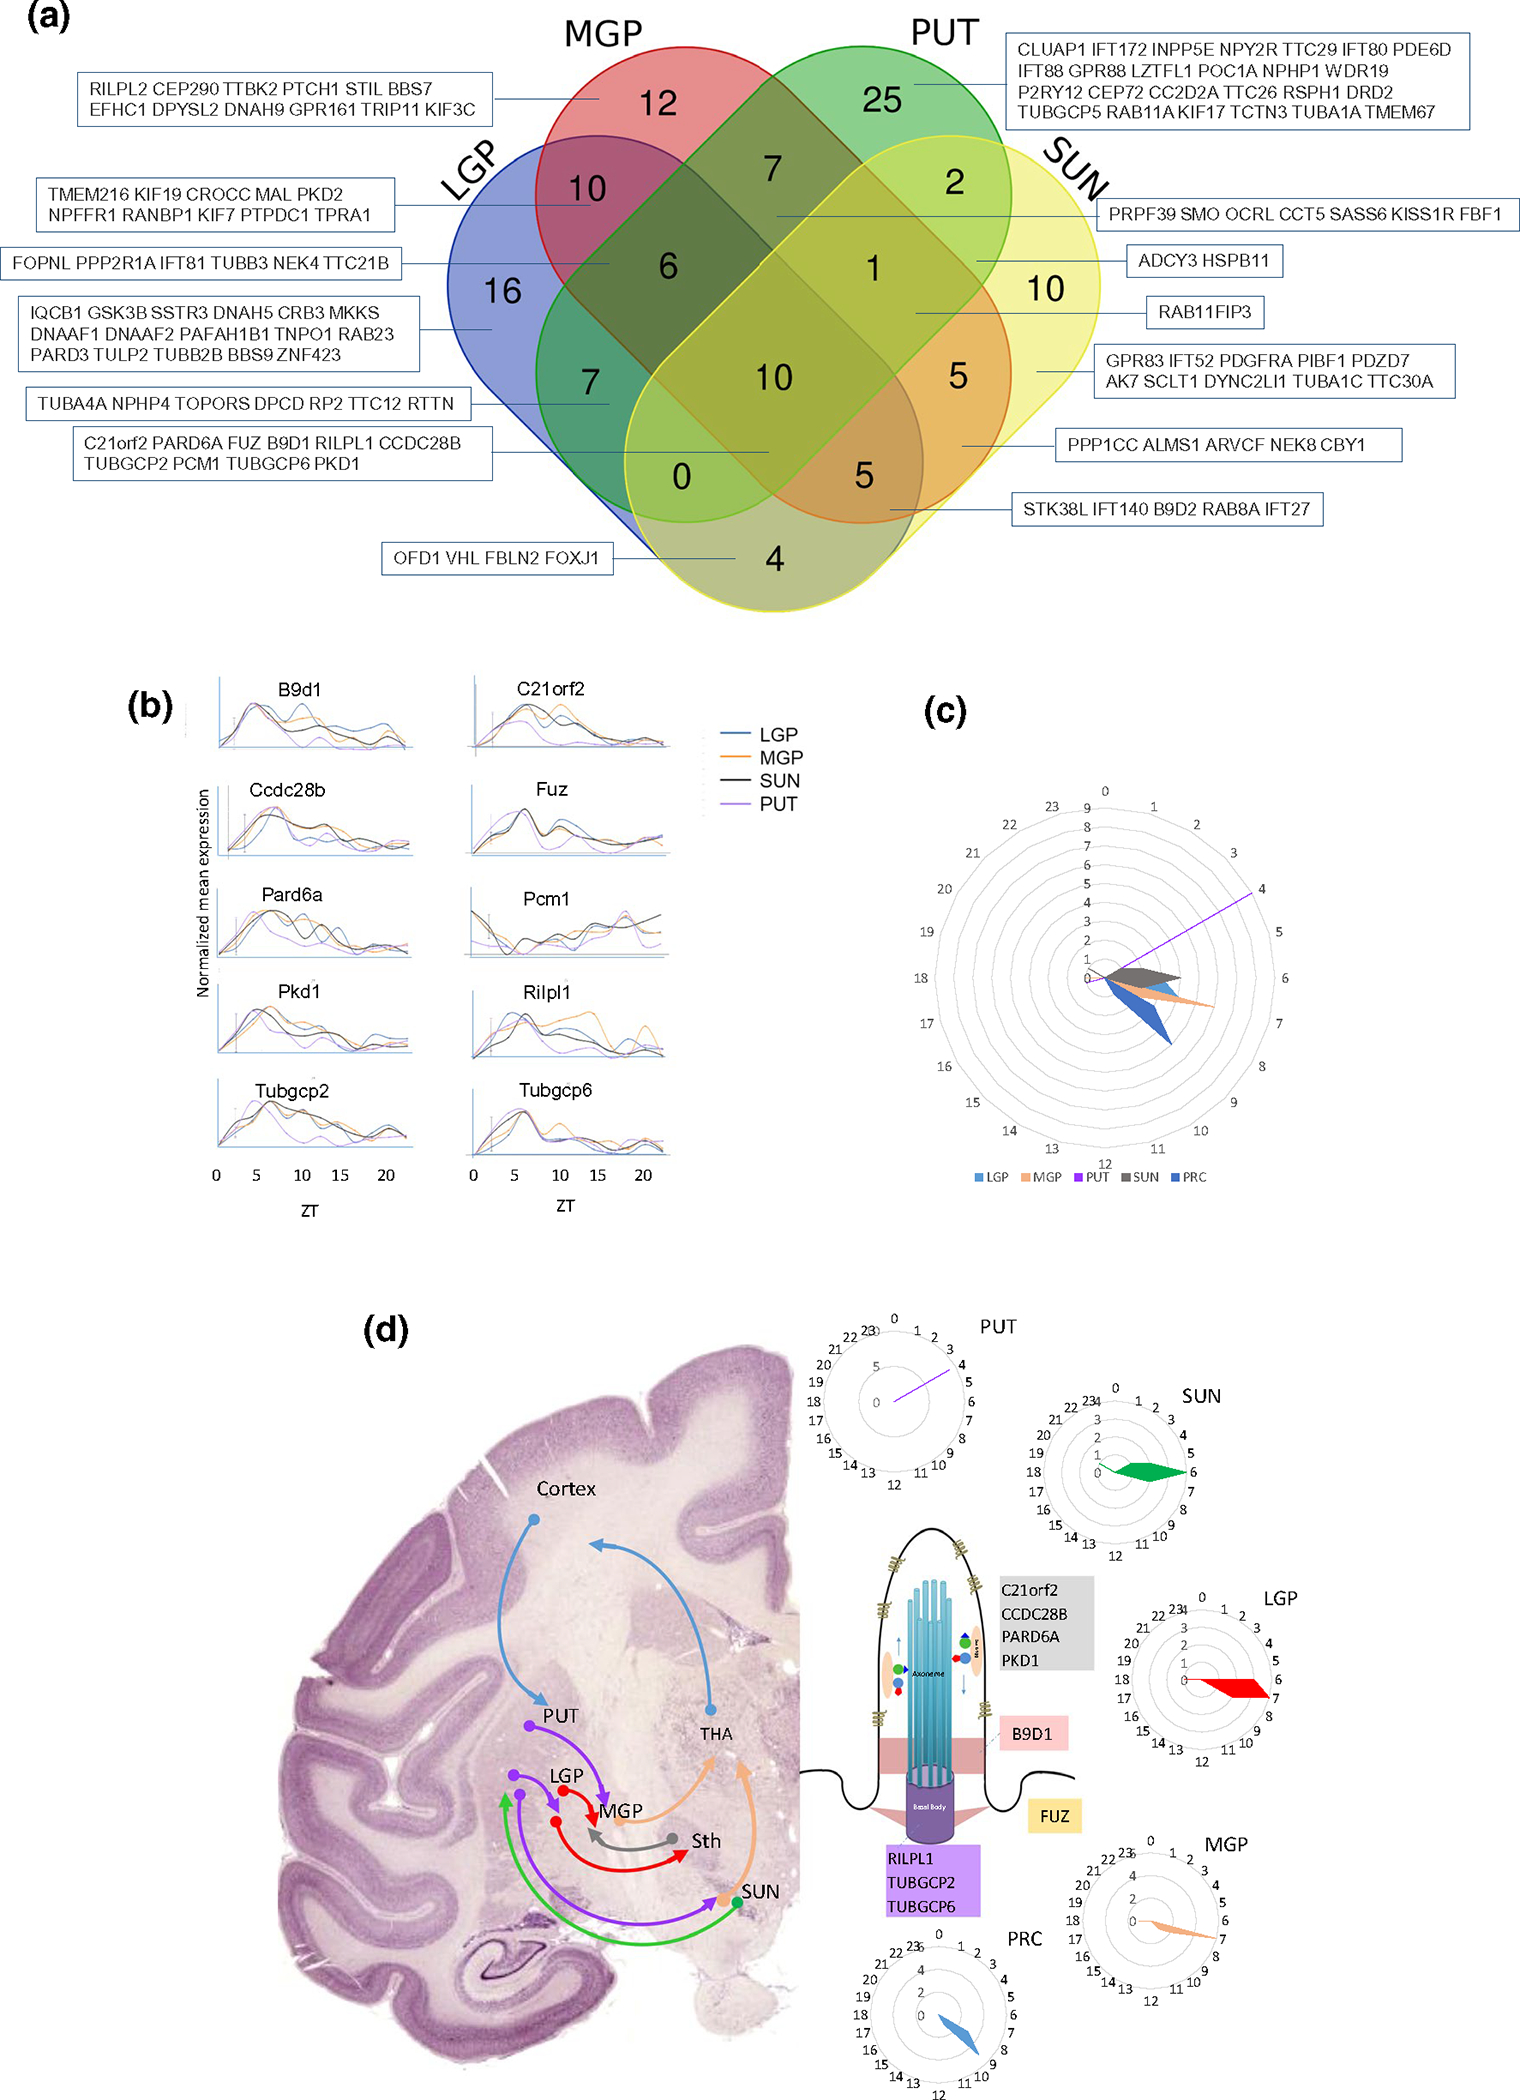
FIGURE 5.

Rhythmicity of the nuclei/regions of the basal ganglia-cortex circuit. (a) Venn diagram showing the overlap between the cilia circadian genes identified in the motor control circuit (nuclei of the basal ganglia and PRC). The overlapping transcripts are shown in boxes. (b) Twenty-four-hour oscillating cilia genes in the basal ganglia nuclei, displayed as normalized expression levels. (c) Radial plot of the distribution of the peak phase of expression of the cilia circadian genes in each of the five brain regions of the motor control circuit. Phases (hours) are displayed on the circumference and the numbers of gene peaks of expression are displayed on the radius. (d) Schematic diagram illustrating the arrangement of information flow through the cortical-basal ganglia-cortical circuit in primate brain (left), and the peak phase of the nine overlapping genes in the nuclei/regions of the circuit (right), with their localized expression in the cilia substructures (middle)
