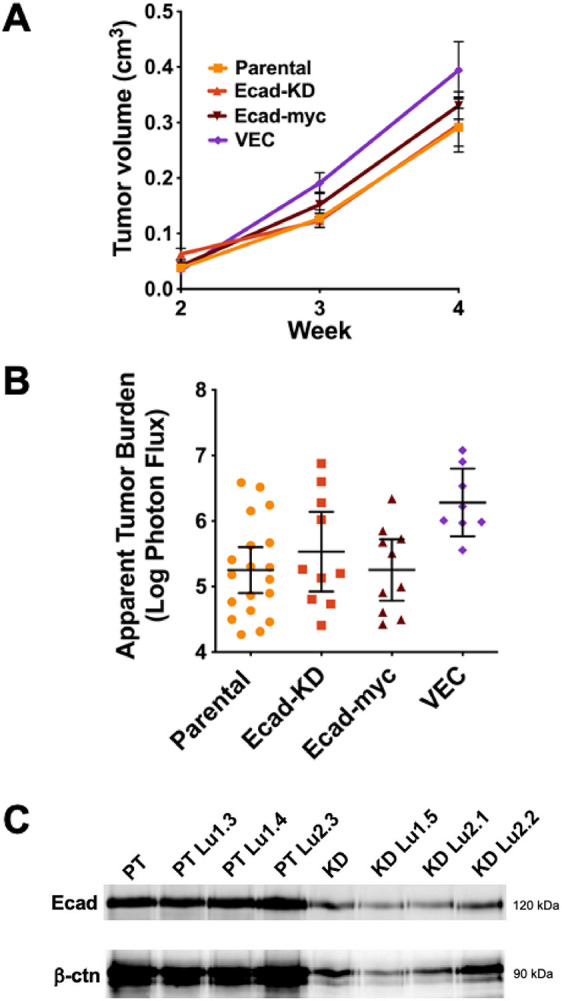
Fig. 3.

The expression level of the E-cadherin–β-catenin complex does not determine the metastatic capacity in the 4T1 breast carcinoma model. (A,B) The pooled results of two separate experiments, in which parental (n=10 mice) and Ecad-KD (n=10 mice) cells, or parental (n=10 mice), Ecad-myc (n=10 mice) and VEC (n=8 mice) cells were orthotopically implanted in Balb/C mice at 5×10³ cells/mouse. (A) Tumor growth at primary injection sites was monitored by caliper measurements over a 4-week period and the tumor volume was plotted. Bars show the mean±s.e.m. (B) The average apparent lung tumor burden for each group was measured at the assay endpoint, as described in the Materials and Methods. Bars show the mean±95% c.i. (C) Cells from lung metastatic tumors of parental (PT) and Ecad-KD (KD) cells implanted in mice were explanted as described in the Materials and Methods, and cell surface-labeled with biotin. E-cadherin levels were measured by immunoprecipitation from lysates of equivalent numbers of each cell type, followed by immunoblotting and detection with NeutrAvidin DyLight 800 (top panel). Co-precipitating β-catenin was detected with mouse anti-β-catenin, recognized by goat anti-mouse Alexa Fluor 680 (bottom panel). Imaging was performed using a LI-COR near-infrared gel imager. Three lung tumor explanted cell lines from both cell types are shown.
