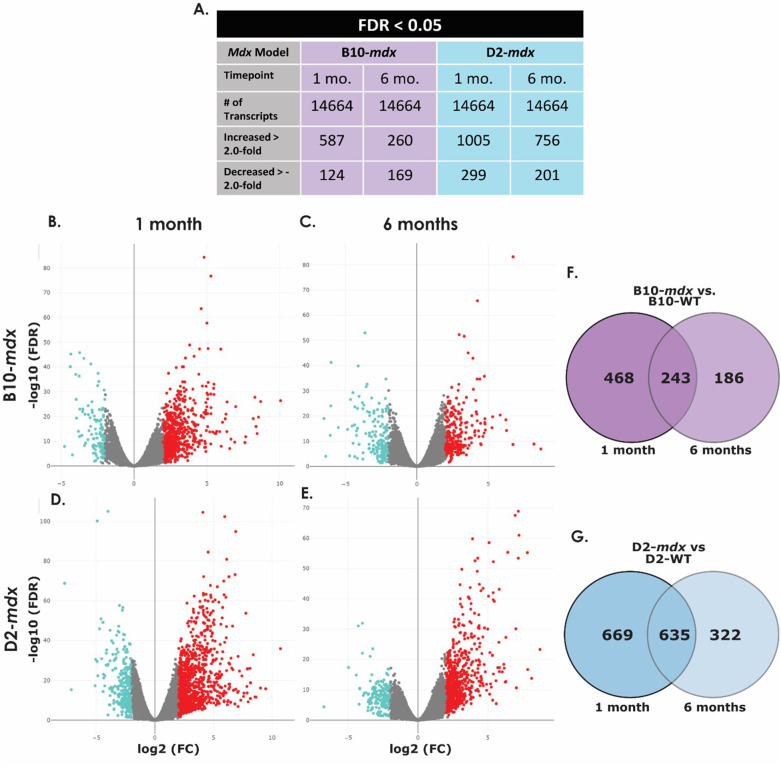
Fig. 1.
Differentially expressed transcripts in mdx mice. Transcripts identified and differentially expressed transcripts in B10-WT versus B10-mdx and D2-WT versus D2-mdx samples at 1 and 6 months of age (A). Volcano plots show transcripts with an increase in expression in red and a decrease in expression in blue of B10-WT versus B10-mdx mice at 1 month (B) and 6 months (C) and D2-WT versus D2-mdx mice at 1 month (D) and 6 months (E) with fold change on the x-axis and significance on the y-axis. Venn diagrams show differentially expressed transcripts that were similar or disparate between B10-mdx at 1 and 6 months of age (F) and D2-mdx samples at 1 and 6 months of age (G). (FC, fold change; FDR, false discovery rate; mo, months of age).

