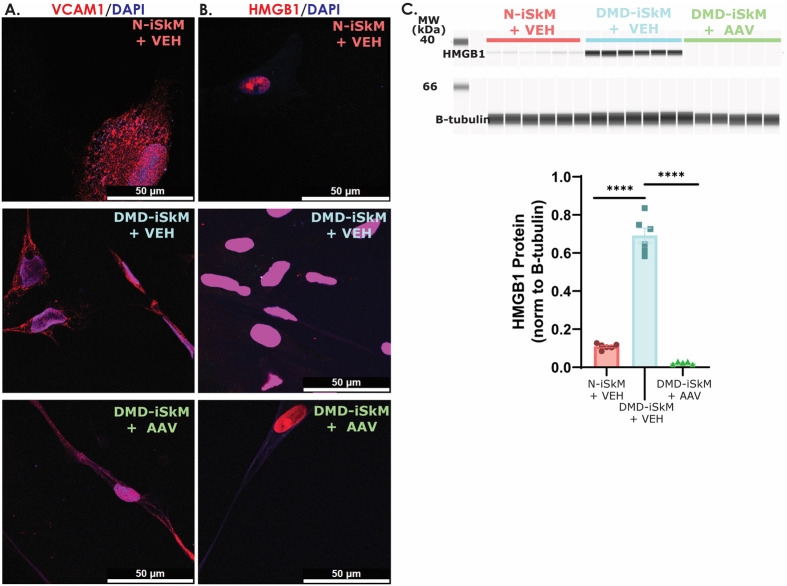
Fig. 4.
HMGB1 levels are increased in DMD-iSkMs and microdystrophin treatment diminishes HMBG1 to N-iSkM levels. (A) VCAM1 IF showed no differences between groups. (B) HMGB1 fluorescence intensity appears to be increased in DMD-iSkM+VEH as compared to N-iSkM and DMD iSkMs+VEH groups. (C) HMGB1 protein content was significantly increased in DMD iSkMs (P-values <0.0001) and rescued similar to N-iSkM levels in DMD-iSkM with microdystrophin treatment.

