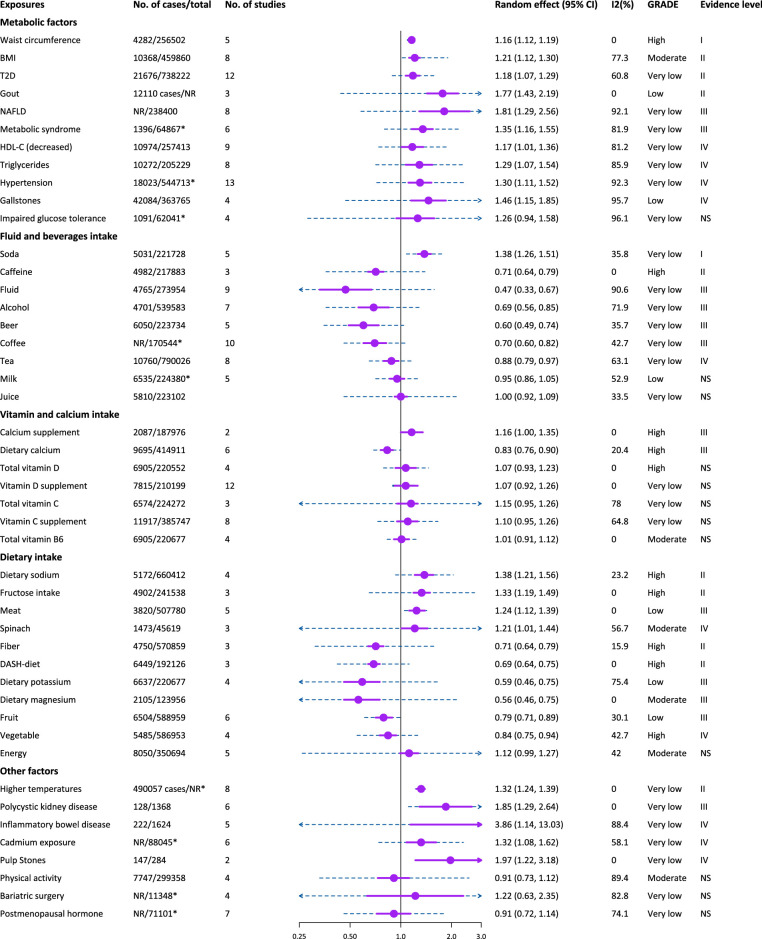
Figure 3.
Forest plot to demonstrate the main results of umbrella review. Purple box and solid line are the effect size with its 95% CIs of meta using random-effect model, and blue dotted line represent 95% prediction intervals. 2hGlu, 2-h glucose after an oral glucose challenge; 25(OH)D, 25-Hydroxyvitamin D; HDL-C, high-density lipoprotein cholesterol; NAFLD, non-alcoholic fatty liver disease; T2D, type 2 diabetes.

