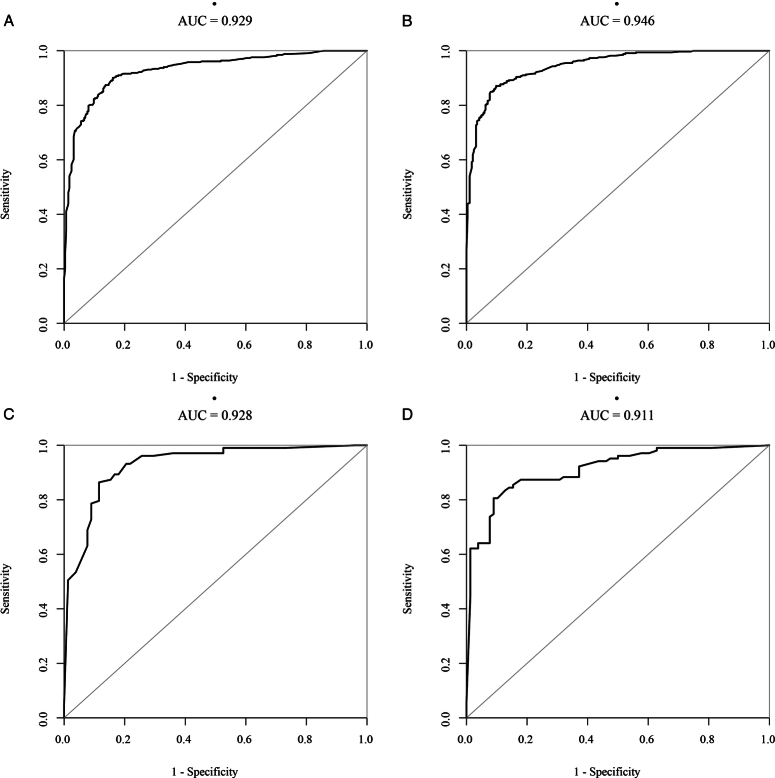
Figure 10.
Machine learning was used to evaluate the accuracy of the coagulopathy model and X1 models in the training and validation groups. (A) The receiver operating characteristic (ROC) curve based on the coagulopathy model in the training group. (B) The ROC curve based on the X1 model in the training group. (C) The ROC curve based on the coagulopathy model in the validation group. (D) The ROC curve based on the X1 model in the validation group.

