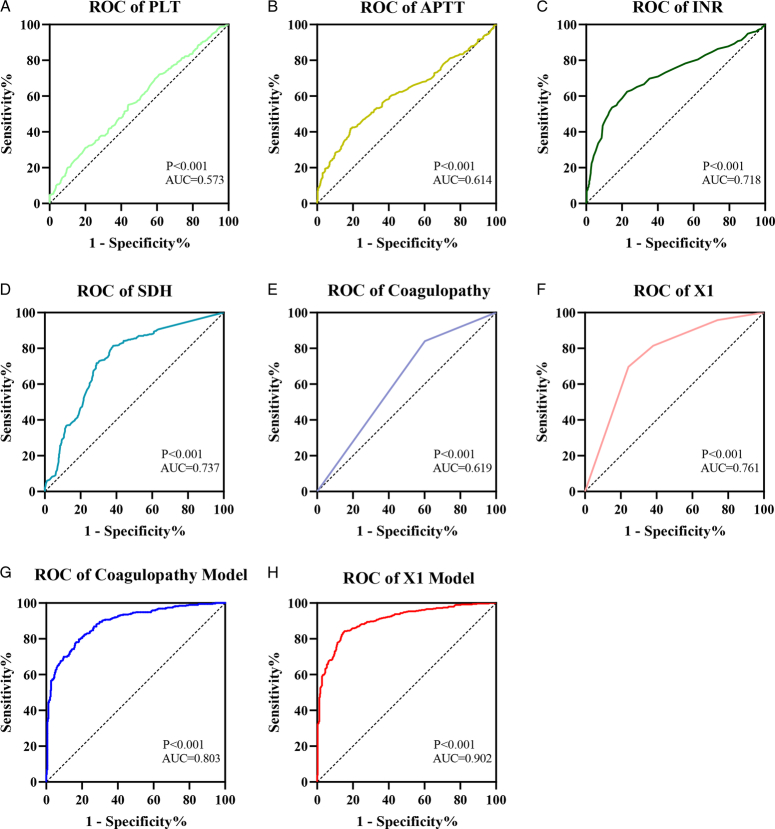
Figure 4.
Area under the curve (AUC) of the PLT, INR, APTT, SDH thickness, coagulopathy, and X1. (A) The AUC of the PLT was 0.573. (B) The AUC of APTT was 0.614. (C) The AUC of INR was 0.718. (D) The AUC of SDH was 0.737. (E) The AUC of coagulopathy was 0.619. (F) The AUC of X1 was 0.761. (G) The AUC of the coagulopathy model was 0.803. (H) The AUC the curve of the X1 Model was 0.902.

