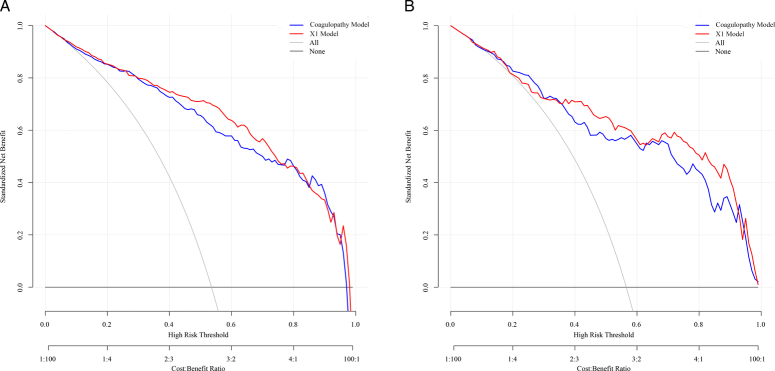
Figure 7.
The decision curve analysis (DCA) based on the coagulopathy model and coagulopathy-hematoma thickness (X1) models were compared in the training and validation groups. (A) DCA of the X1 model was compared with DCA of the coagulopathy model in the training group. (B) DCA of the X1 model was compared with DCA of the coagulopathy model in the validation group.

