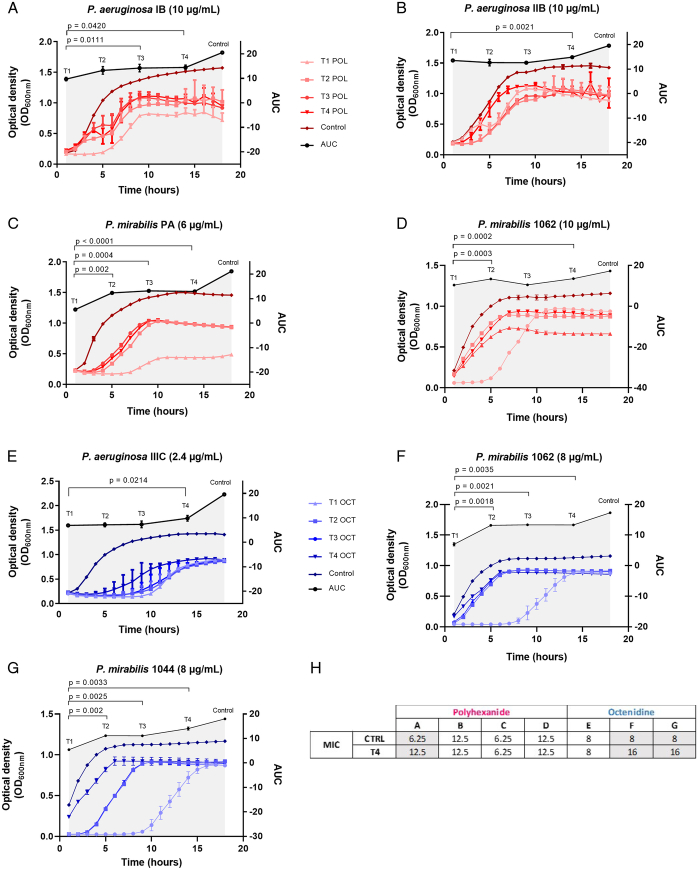
Figure 2.
Bacterial adaptation to constant low-level concentrations of polyhexanide and octenidine. (A-G) Different bacterial isolates were challenged with either polyhexanide (POL, red curves) or octenidine (OCT, blue curves) at concentrations indicated in brackets after the strain designation; Shown are liquid culture assays of bacterial isolates that have been challenged with constant low-level concentrations for four times (T1 to T4; T1=first exposure, T2=second exposure, etc.). Bacterial growth was measured via optical density at 600 nm (OD600nm). Adaptation is evident by an earlier re-growth of T2 compared to T1, or T3 compared to T2, and so on. The significance of the acquired tolerance was determined via comparison of the area under the curves (AUC) calculated from the growth curves and is indicated by the gray shade. The control refers to the growth of the parental strain that was not exposed to the antiseptics. All experiments were performed as three independent biological replicates. Given P values indicate statistical support for an enhanced bacterial tolerance between the different generations (T1–T4). (H) Comparison of the MIC values of the adapted strains from T4 with the parental strains (Ctrl=control). The letters A-G refer to the seven bacteria/antiseptic challenges, as displayed in Figure 2.

