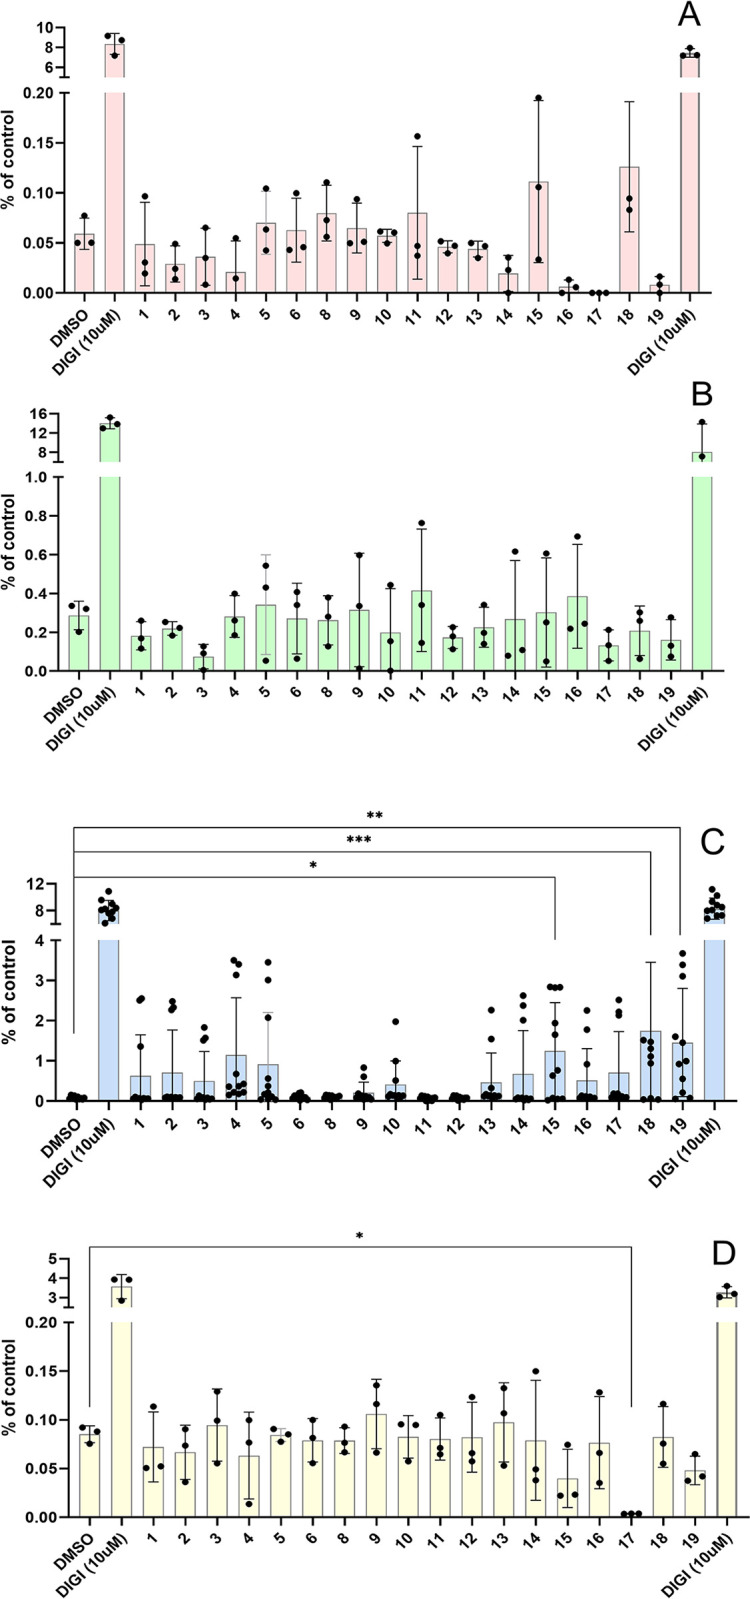
Fig 5. Changes in intracellular calcium after stimulation with preptin and its analogs at the concentration 10−4 M.

Murine fibroblasts with deleted igf1r gene (R- cells) (A), MC3T3-E1 preosteoblasts (B), U-2 OS osteoblasts (C) and MIN6 pancreatic beta cells (D). Data are presented as means ± S.D., relative to the signal in non-stimulated cells. Significant differences between marked values determined, using Ordinary one-way ANOVA (Dunnett´s multiple comparisons test), *p < 0.05, **p < 0.01, ***p < 0.001, ****p < 0.0001.
