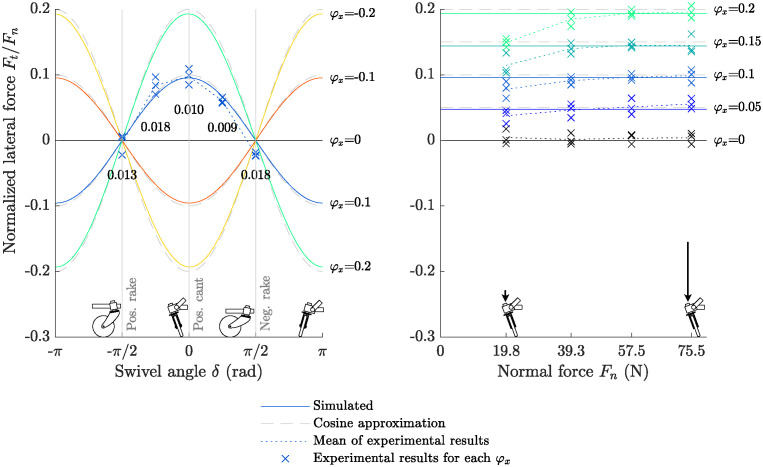
Fig 5. Lateral force on castor wheel as measured with the instrumented castor wheel on the treadmill, compared to simulated predictions.
Left: Normalized lateral tire force Ft as a function of the swivel angle δ for multiple cant angles φx. Solid lines correspond to the full system given in Eqs 5 and 6; dashed lines correspond to Eq 13. Experimental results for a cant angle of φx = 0.1 rad (blue crosses for data points, dotted line for mean) were collected. The RMSE over the 3 trials with respect to the simulation is printed below the crosses. The pictographs of the front and side view of the castor wheel on the swivel angle axis depict a castor wheel with a positive cant angle under the given swivel angles. A rake angle (or combination of cant and rake) can be read from the graph at δ = −90°, as a rake angle is equivalent to a cant angle when the direction of movement is rotated by 90°. Right: Normalized lateral tire force Ft as a function of the normal force Fn for multiple cant angles φx. Solid lines correspond to the simulated system. The normal force is read from the force at the force sensor and does not include the weight of the castor wheel and fork. Experimental results (blue crosses for data points, dotted line for mean) were collected for each shown cant angle.

