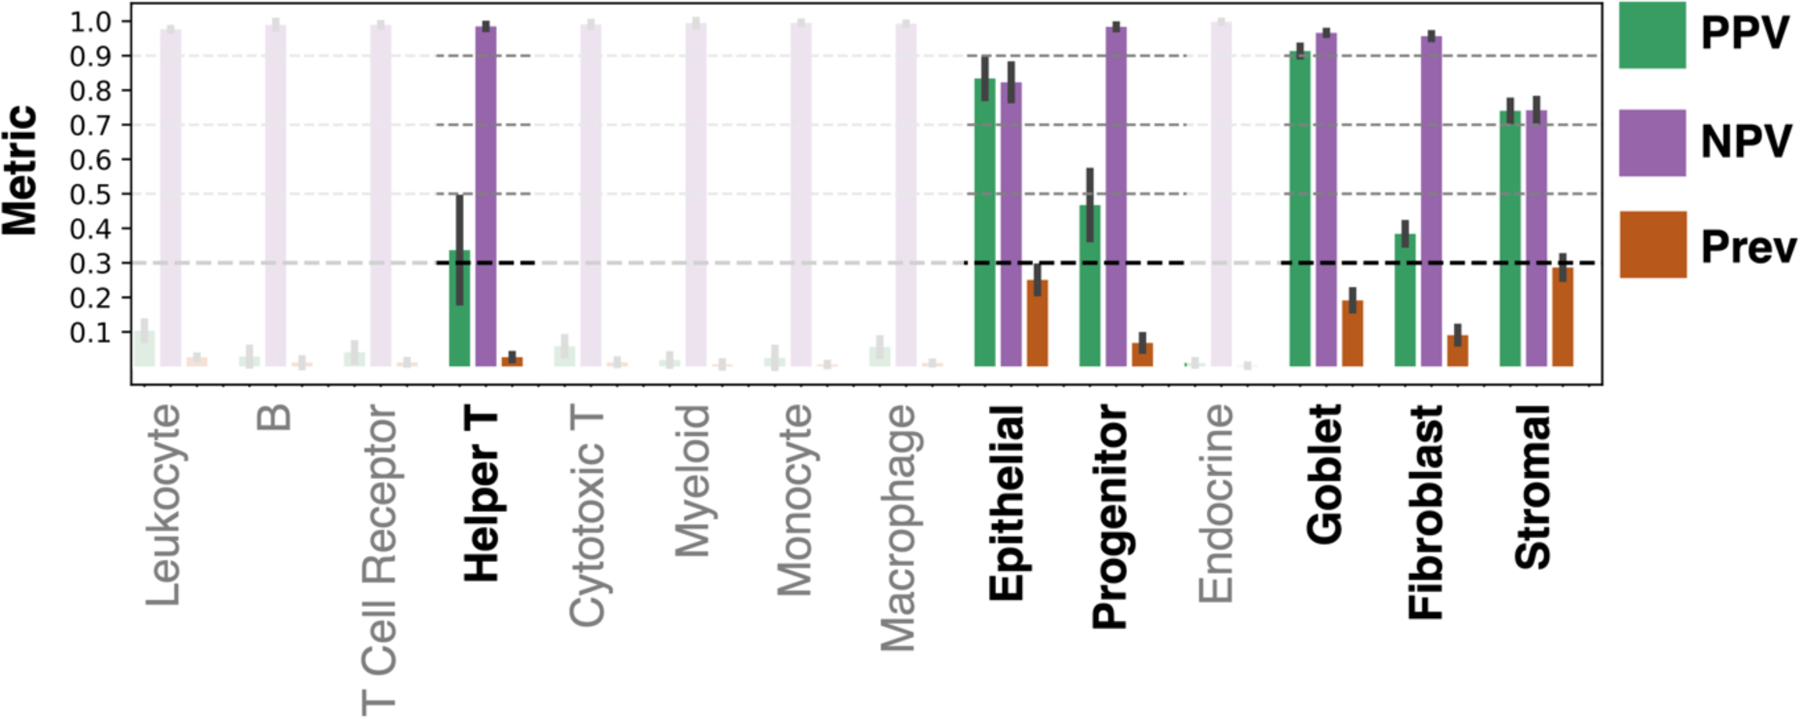
Figure 4.

Learning MxIF stain information from virtual H&E is a challenging task, as illustrated by the positive predictive value (PPV), negative predictive value (NPV), and prevalence (Prev) for our pipeline across the 14 nucleus classes. The bar plot gives the mean value and each error bar denotes ± the standard deviation from cross-validation. We focus on the classes that could be identified with a mean PPV above 0.3, while the remaining classes are faded indicating lack of learning. The use of PPV, NPV, and prevalence allows us to better understand how the model would perform, if extended to unlabeled data, than the accuracies given in Figure 3.
