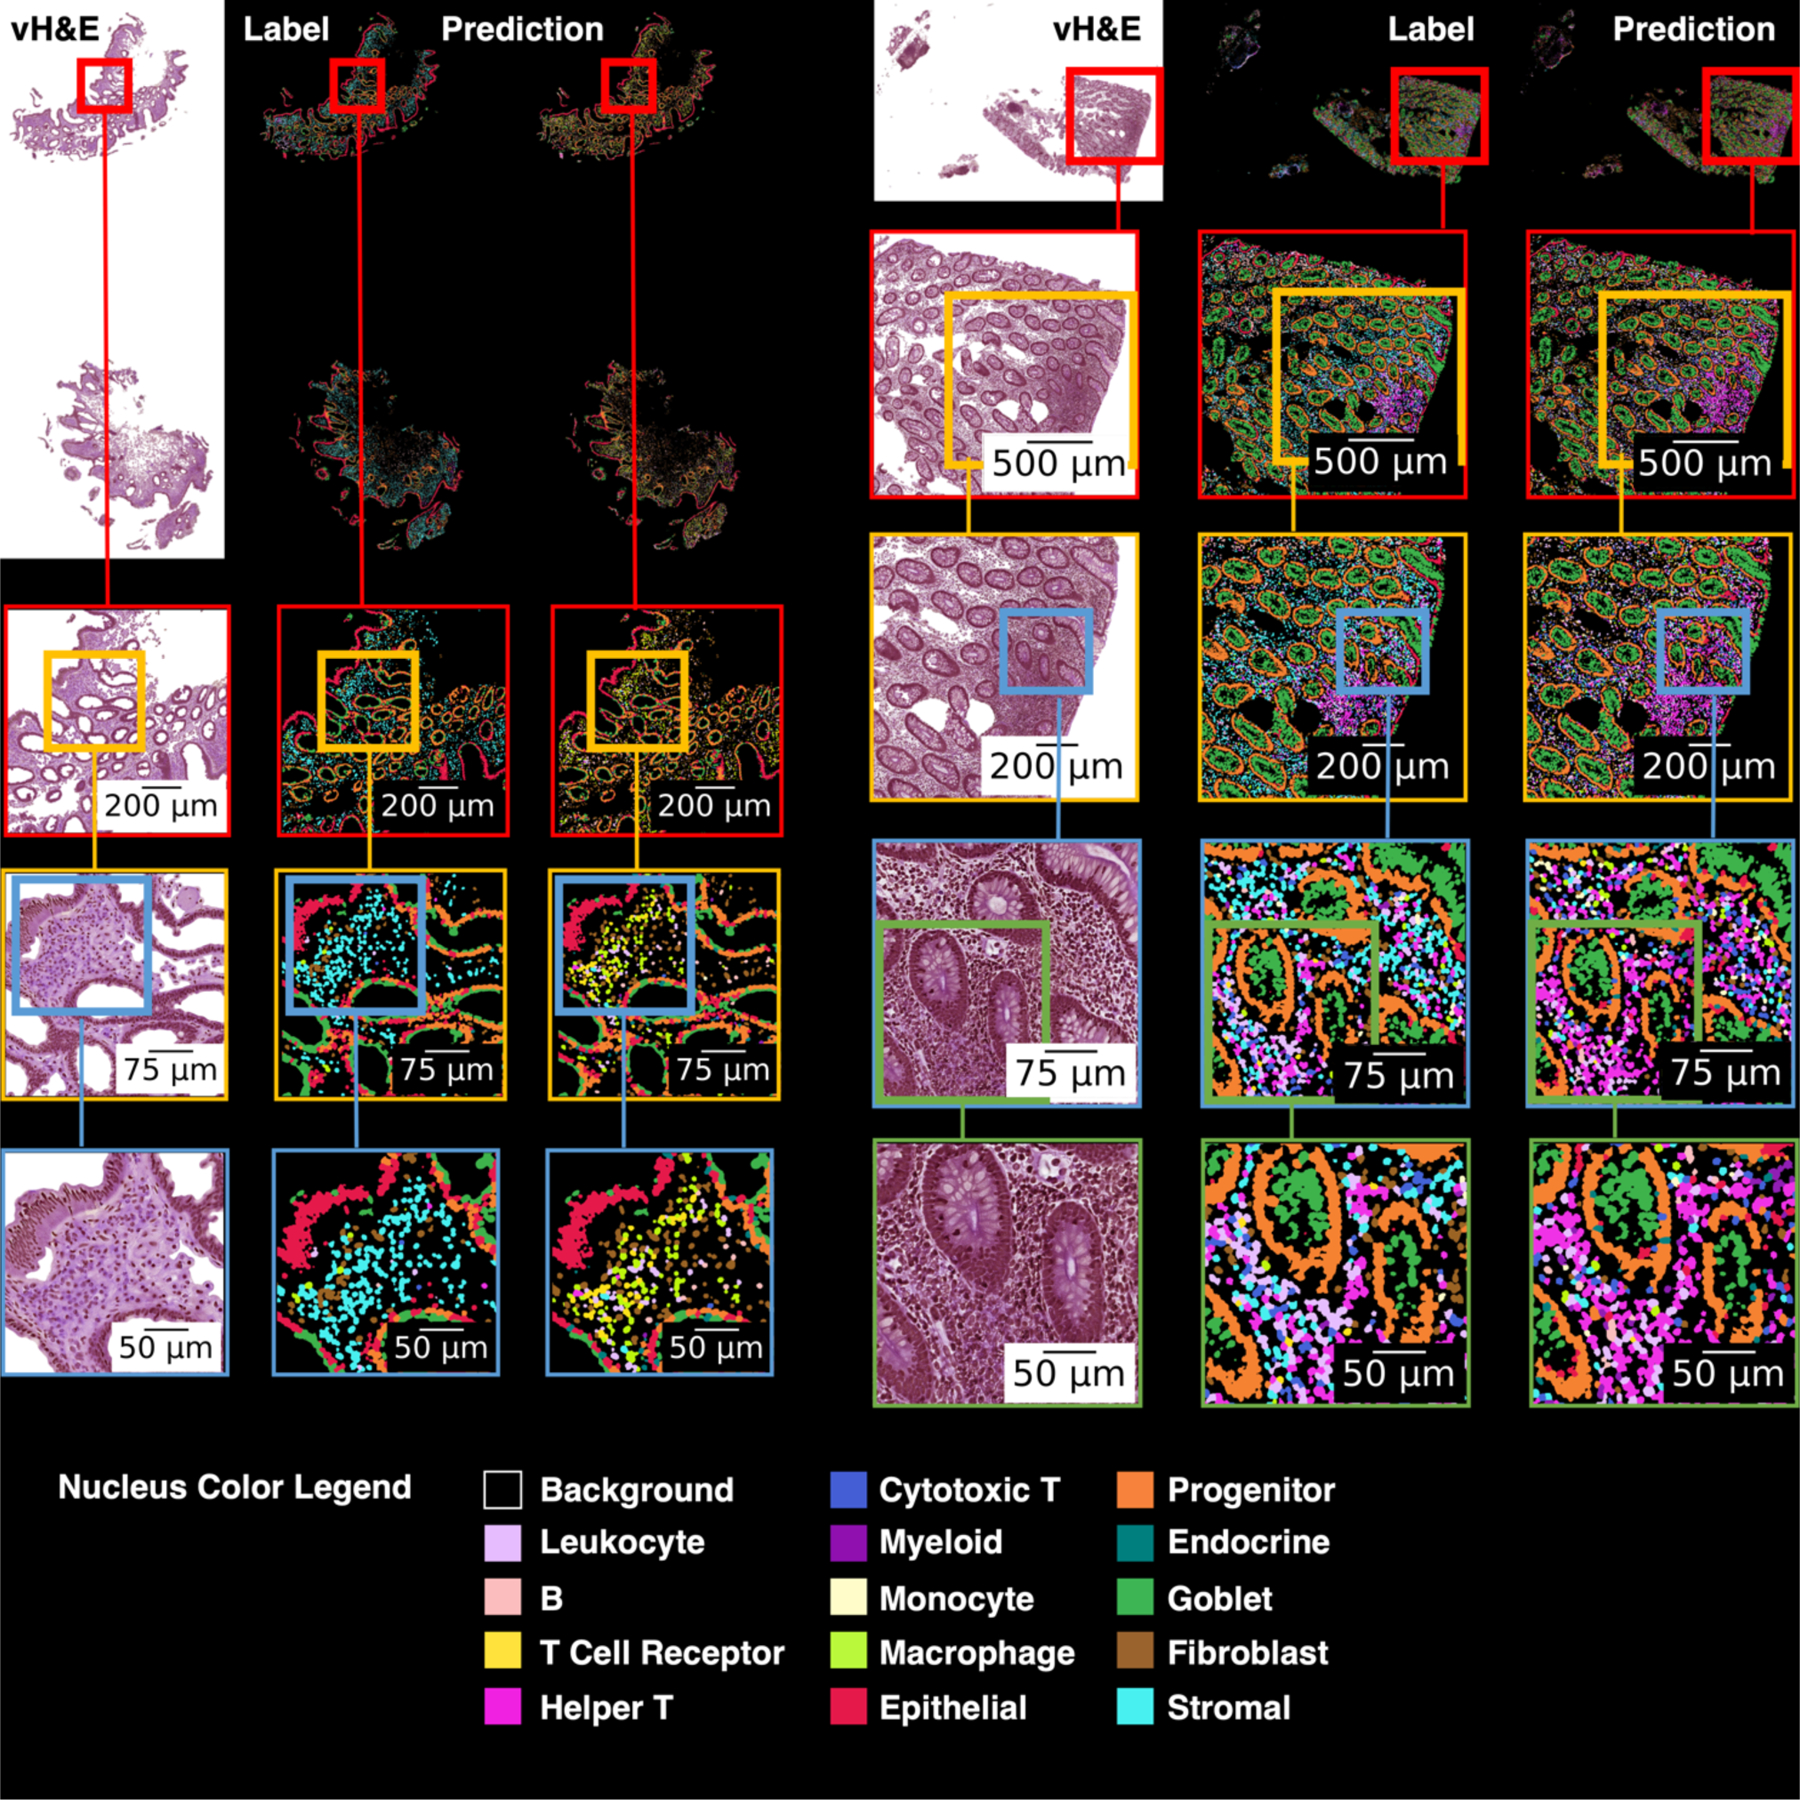
Figure 5.

This figure shows virtual H&E, cell labels, and predicted labels for two whole slide images. At the top of the figure the full images are shown, and each subsequent row shows a magnified region of interest. On the left image, when fibroblasts are incorrectly predicted, the label is often stromal (both cell types are connective tissue cells). Stromal cells are often incorrectly classified as a variety of immune cells. On the right image, nuclei in an area with immune cell activity are often correctly identified as helper T cells, though the predictions do include a non-trivial number of false positives for helper T.
