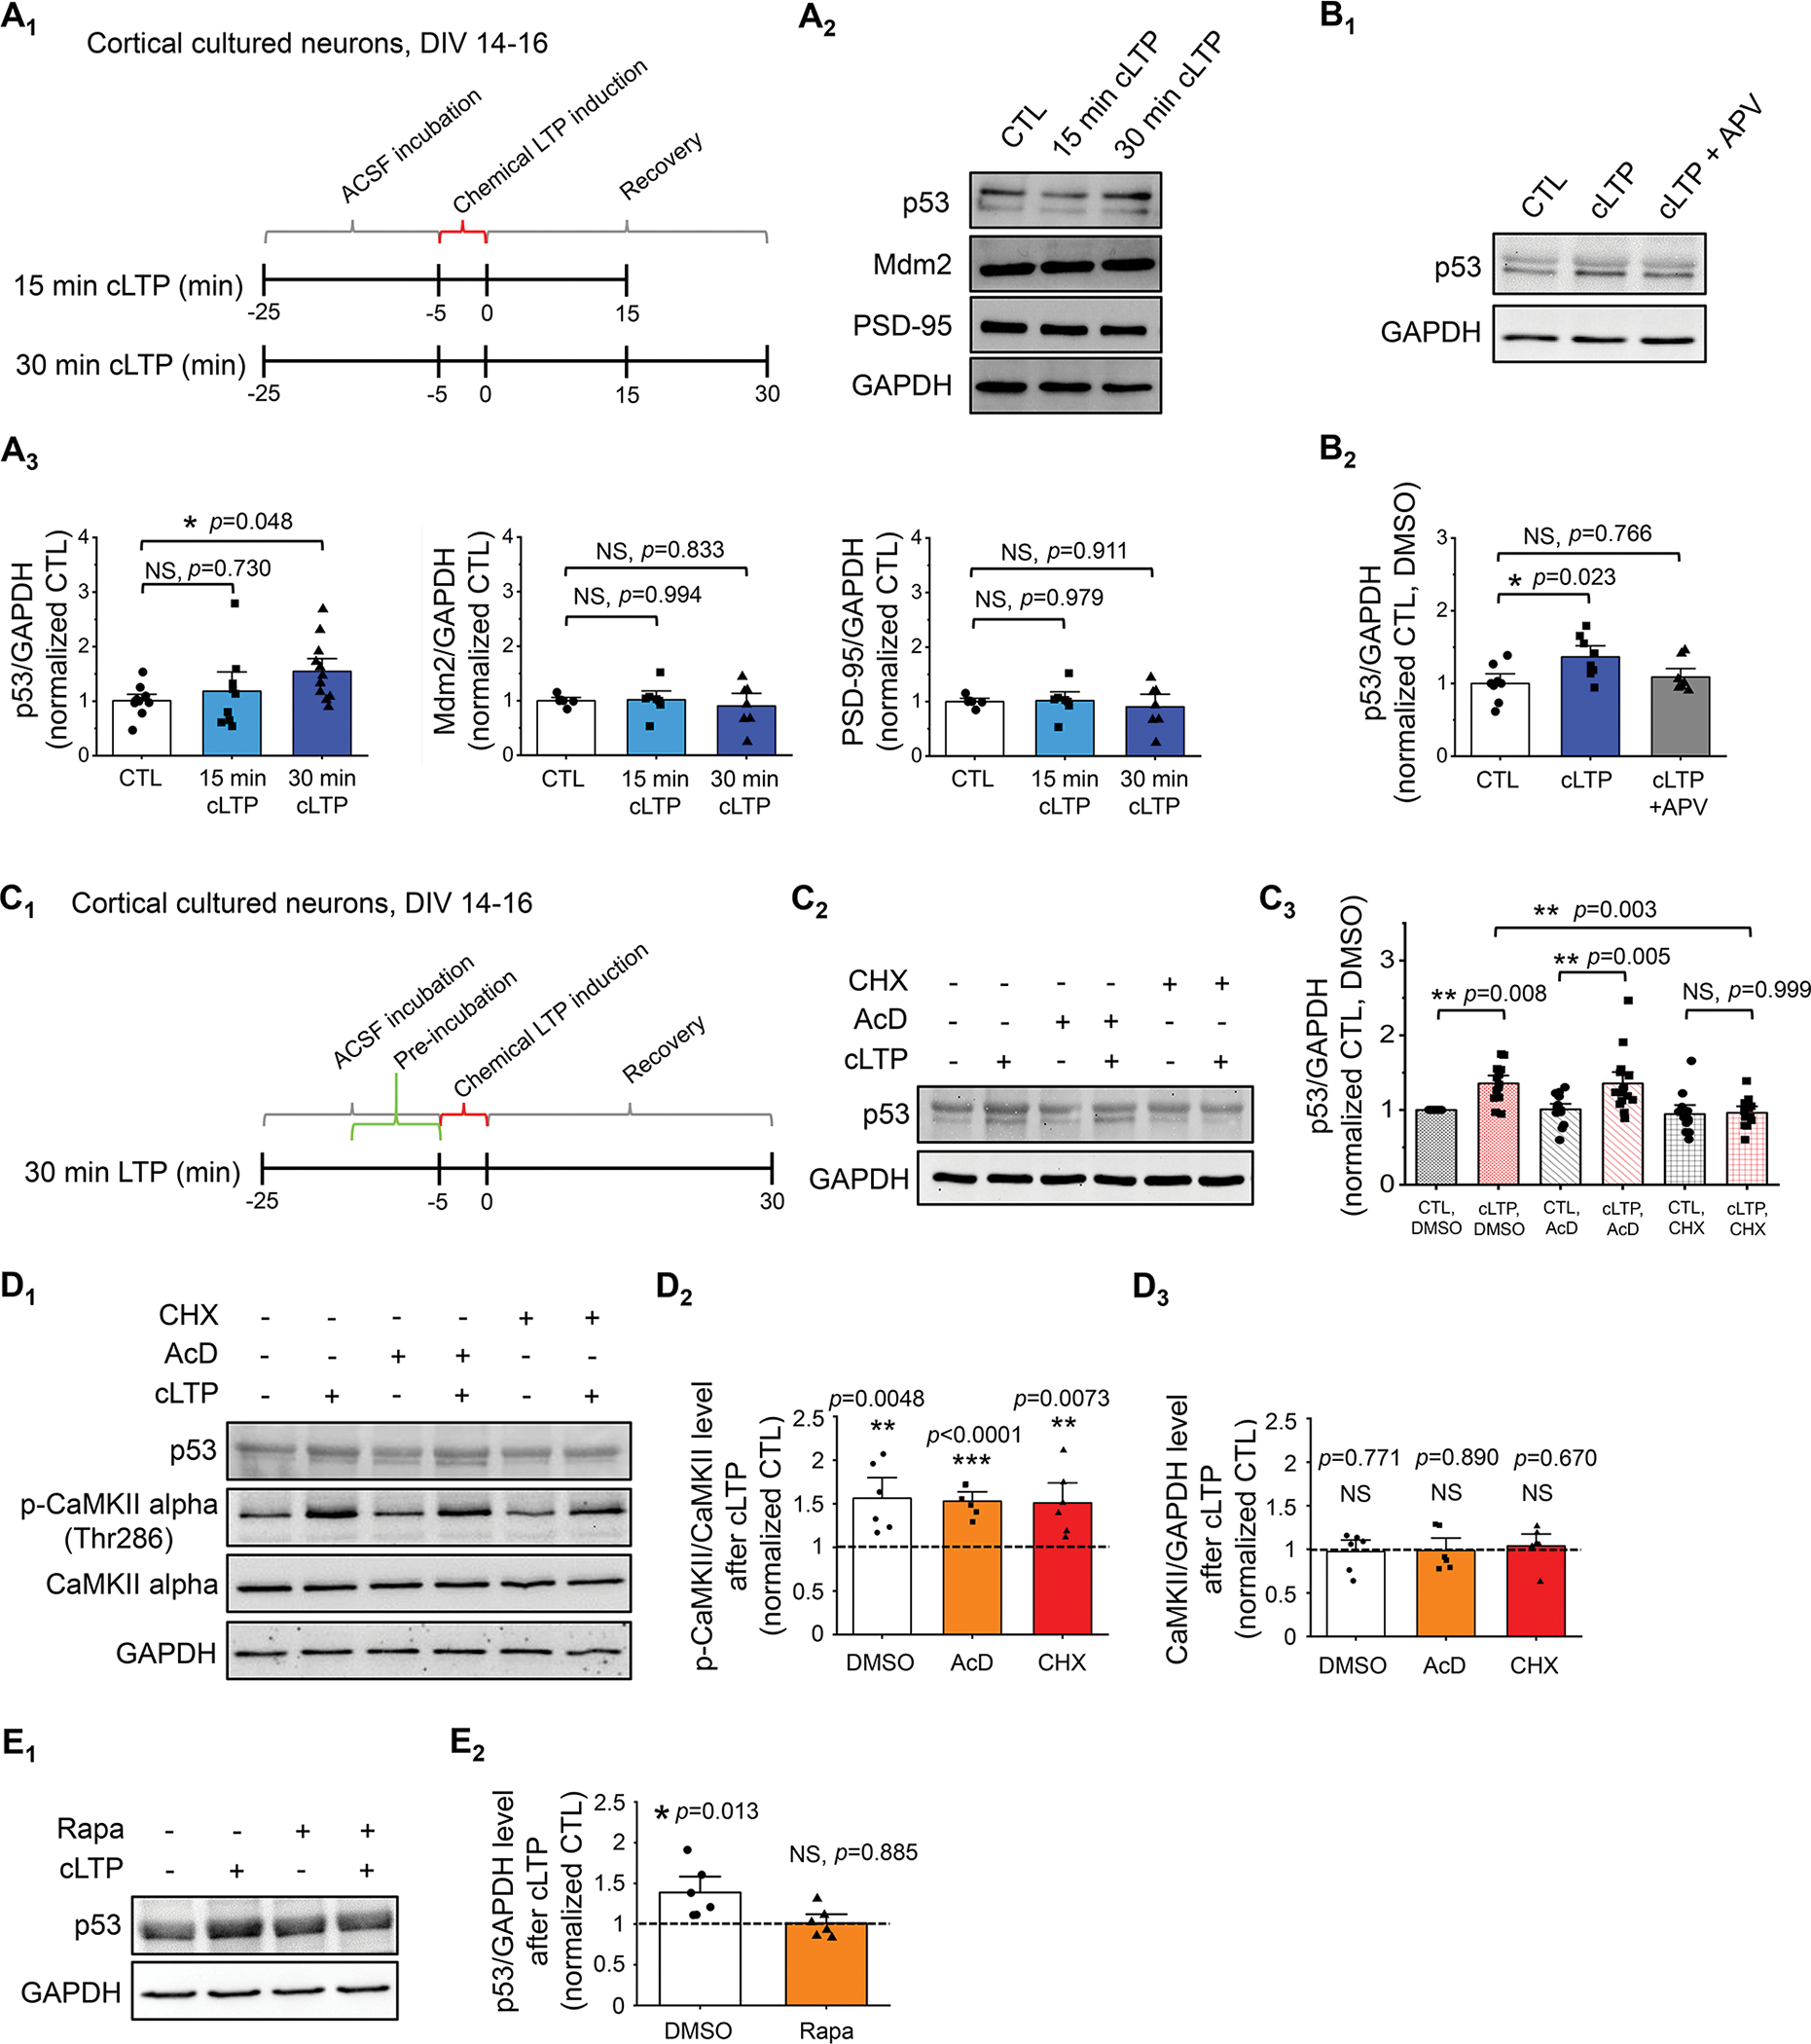
Figure 1. p53 protein expression is induced by cLTP.

(A) Schematic representation of the experimental design for 5-min glycin-induced cLTP (A1), representative western blots of p53 and representative western blots of p53, Mdm2, PSD-95, and GAPDH after cLTP induction in WT cortical culture neurons at DIV 14–16 (A2), and quantification (A3) are shown (n = 9–12 individual cultures per condition for p53/GAPDH and n = 6–7 individual cultures per condition for Mdm2/GAPDH and PSD-95/GAPDH). For quantification, data from 15 min and 30 min cLTP were normalized to data from control condition (CTL). (B) Quantification and representative western blots of p53 following cLTP induction in the presence or absence of 10-min pre-treatment of 100 μM APV, an NMDA receptor blocker (n = 8 individual cultures per condition). (C) Schematic representation of the experimental design for cLTP with pretreatment of drugs (C1), representative western blots of p53 following cLTP induction in the presence or absence of 10 min pre-treatment of 0.1% DMSO (Control, CTL), 60 μM cycloheximide (CHX), or 20 μM actinomycin-D (AcD) (C2) and quantification (C3) are shown (n = 12–15 individual cultures per condition). (D) Quantification of p53 and representative western blots of p53, GAPDH, CaMKII alpha, and phospho-CaMKII alpha-Thr286 after cLTP induction in the presence or absence of 10 min pre-treatment of 0.1% DMSO, 20 μM actinomycin-D (AcD), or 60 μM cycloheximide (CHX) (n = 6 individual cultures per condition). (E) Quantification of p53 and representative western blots of p53 and GAPDH after cLTP induction in the presence or absence of 10 min pre-treatment of 0.1% DMSO or 1 μM rapamycin (Rapa) (n = 6 individual cultures per condition). Data were analyzed by one-way ANOVA with Tukey test (A, B), two-way ANOVA with Tukey test (C), or Student’s t-test (D, E) and presented as mean ± SEM with *p < 0.05, **p < 0.01 and NS: non-significant.
