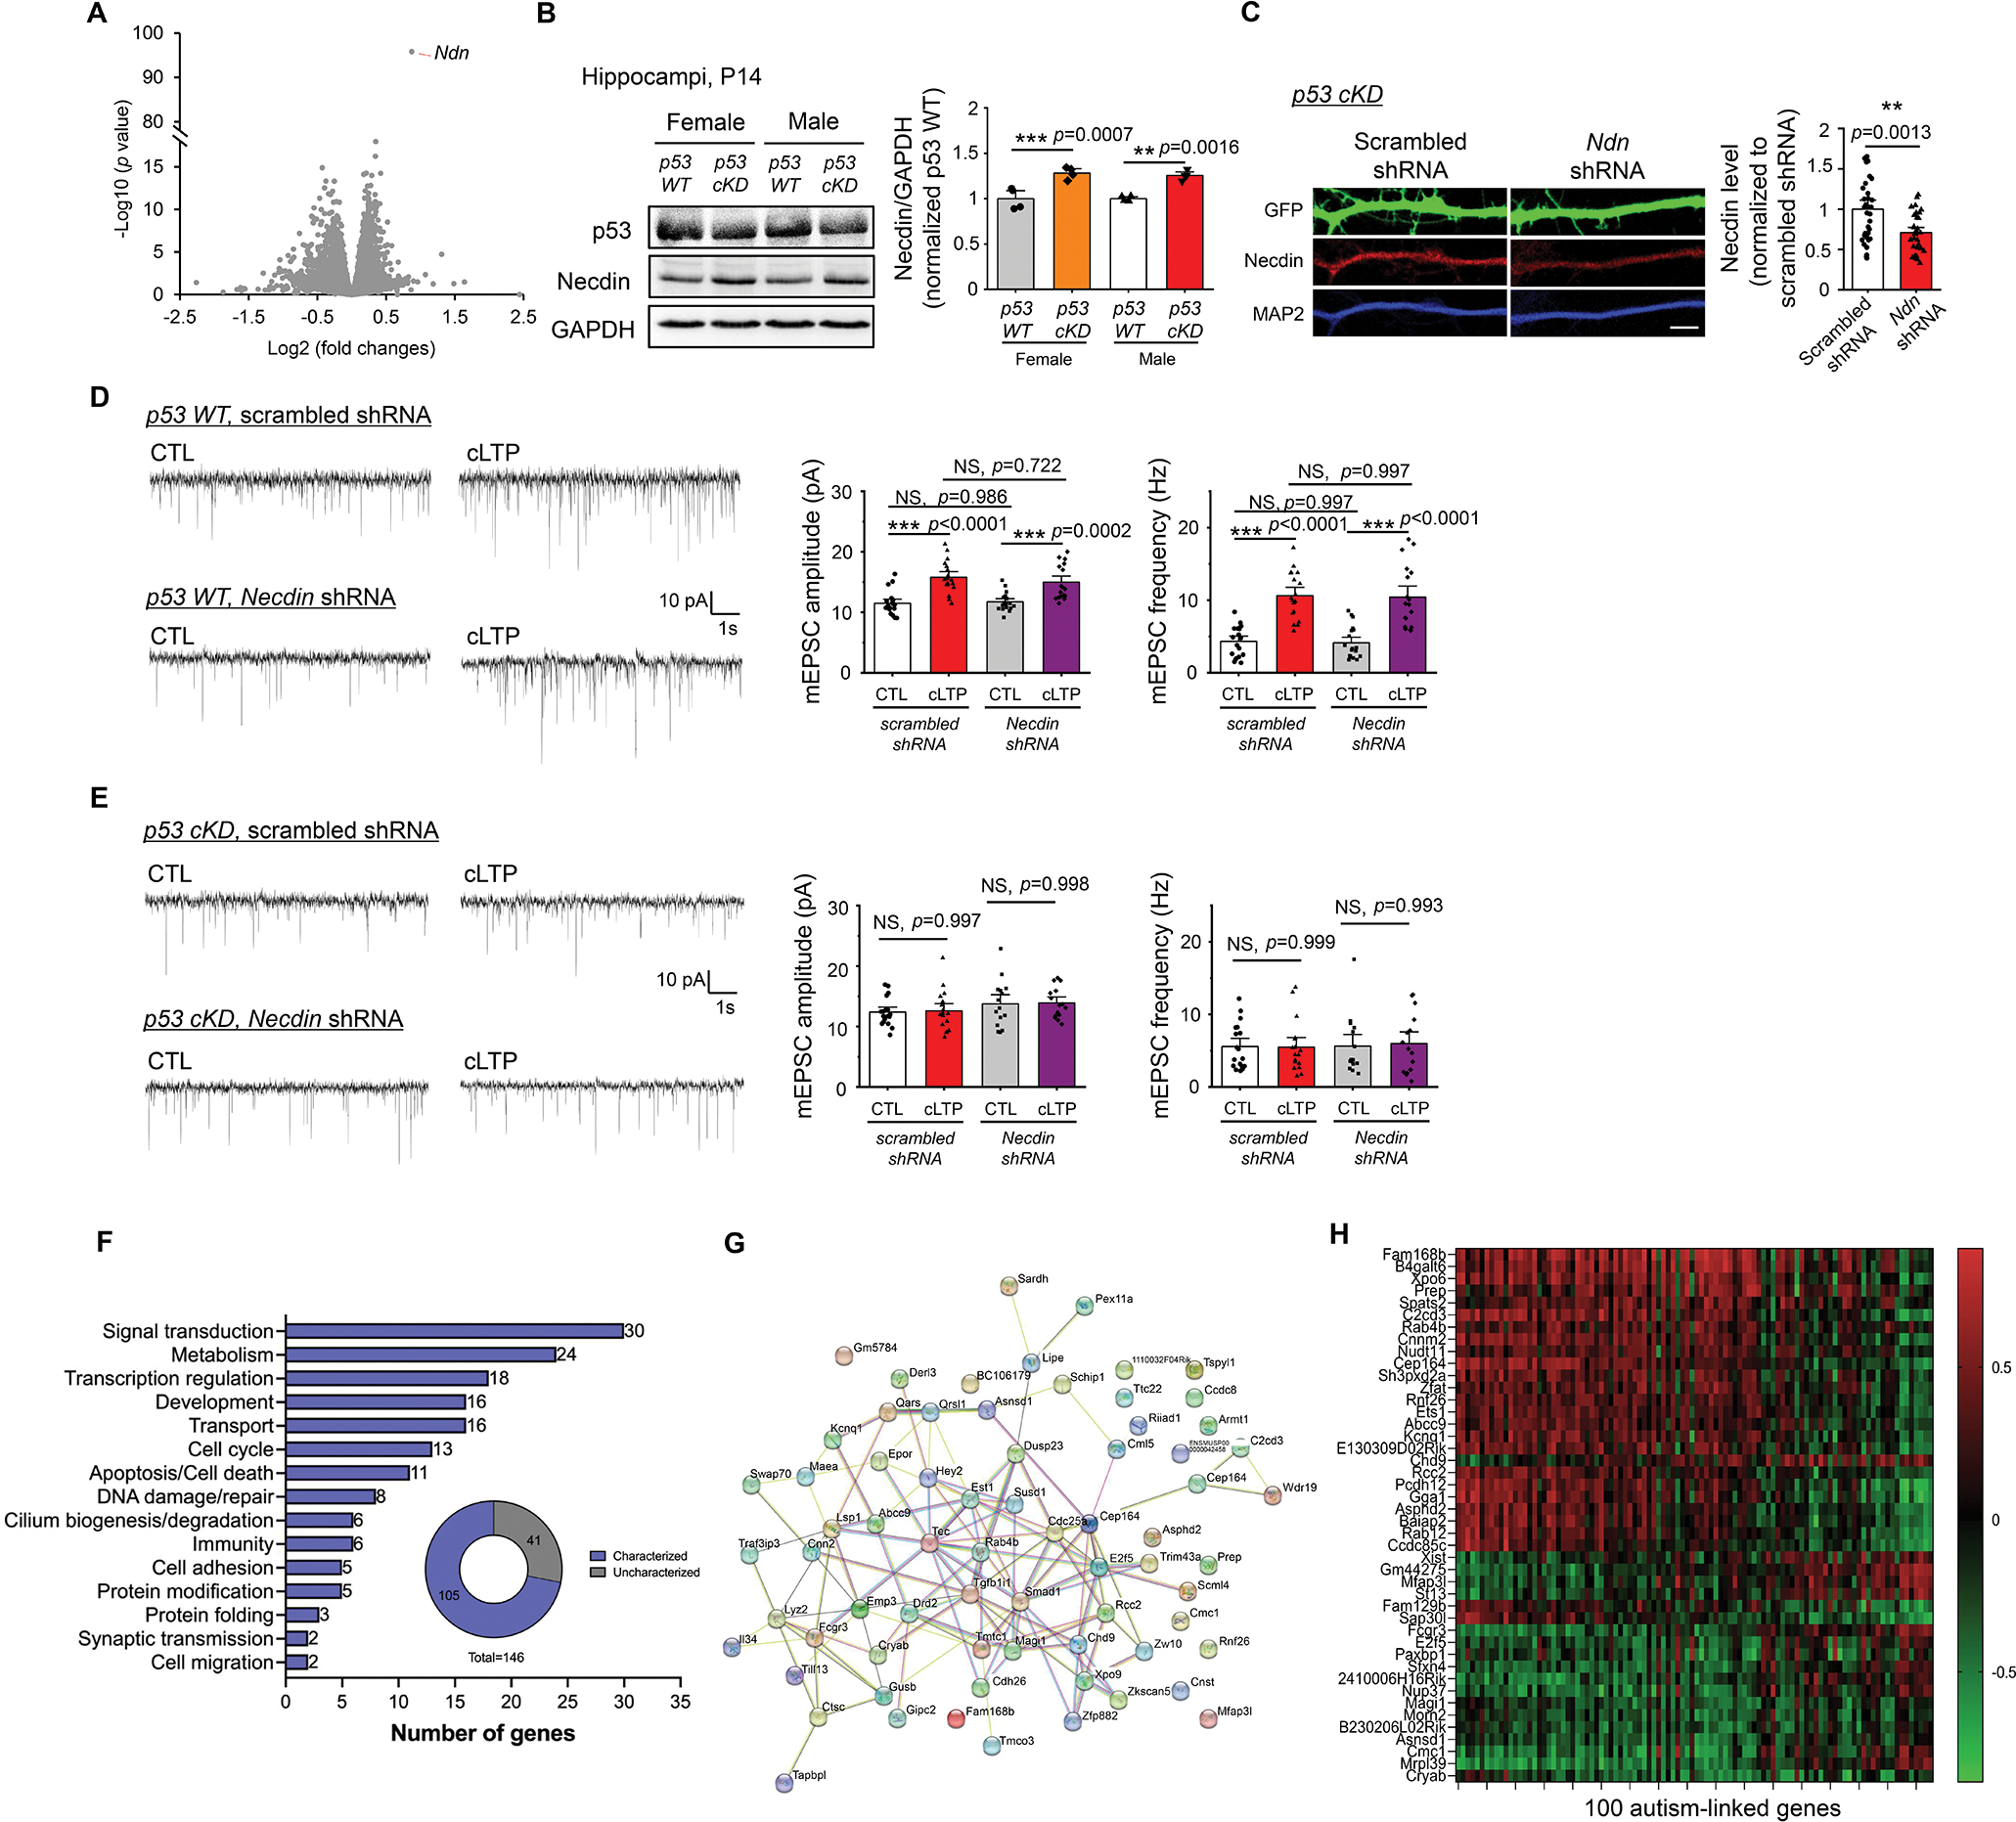
Figure 6. RNAseq reveals p53-associated genes potentially involved in synaptic plasticity, learning and memory.

(A) A volcano plot following RNA sequencing analysis using hippocampi from male p53 WT and male p53 cKD mice at P14 (n = 5 mice per genotype). (B) Western blots of Necdin and GAPDH from male or female, p53 WT or p53 cKD, hippocampi at P14. Representative western blots (left) and quantification (right) are shown. (n = 4 mice per genotype). For quantification, data from p53 cKD hippocampi were normalized to data from p53 WT hippocampi. (C) Immunocytochemistry showing GFP, Necdin, and dendritic marker MAP2 from cultured p53 cKD hippocampal neurons transfected with a scrambled shRNA or Necdin shRNA. Representative dendritic images (left) and quantification for Necdin (right) are shown (n = 34 and 32 neurons for scrambled shRNA and Necdin shRNA, respectively). Scale bar: 5 μm. (D, E) Patch-clamp recording from cultured p53 WT (D) or p53 cKD (E) hippocampal neurons transfected with scrambled shRNA or Necdin shRNA and induced with or without cLTP at DIV 12–16. Representative mEPSC traces (left) and quantification of mEPSC amplitude and frequency (right) are shown (n = 15–19 neurons per condition). (F, G, H) Summary of major functional categories of 105 genes that are associated with p53 and differentially expressed in a sex-dependent manner (F), STRING analysis showing functional connection network of those genes identified (G), and a heatmap showing the levels of correlation between the top 44 genes that exhibit significant correlations with the known known autism-linked genes (H). Data were analyzed by Student’s t-test (A, B, C) or two-way ANOVA with Tukey test (D, E) and presented as mean ± SEM with **p < 0.01, *** p < 0.001 and NS: non-significant.
