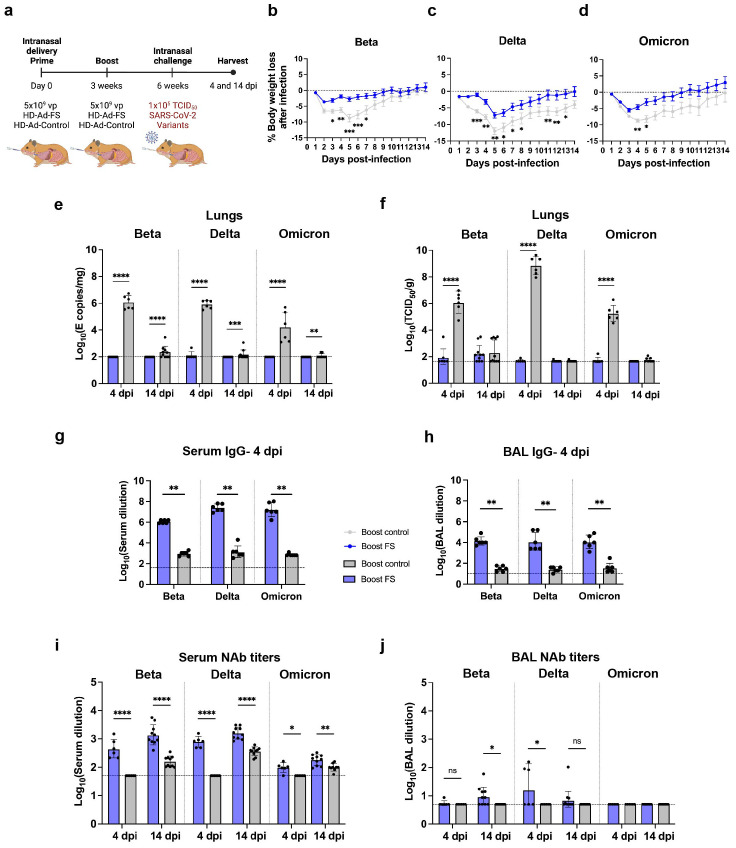
Figure 6.
Prime-boost vaccination of HD-Ad-FS protected hamster against SARS-CoV-2 VOCs in the lungs. (A) Schematic timeline of the hamster experiment. Hamsters were intranasally immunized with a prime-boost regimen of HD-Ad-FS or HD-Ad-control (5x10⁹ + 5x10⁹ vp, three-week interval). Three weeks after the second dose, the hamsters were intranasally challenged with SARS-CoV-2 variants (Beta, Delta, or Omicron) at 1x10⁵ TCID50. (B-D) Hamster body weight was monitored at the indicated days after challenging with SARS-CoV-2 variant Beta (B), Delta (C), or Omicron (D). (E) RNA levels of SARS-CoV-2 variants in the lungs were determined with RT-qPCR at 4 and 14 dpi. (F) Levels of infectious SARS-CoV-2 variants in the lungs were measured with TCID50 assay at 4 and 14 dpi. (G) The titers of FS-specific IgG in sera were measured with ELISA at 4 dpi. The starting dilution factor was 1:40. (H) The titers of FS-specific IgG in BALs were measured with ELISA at 4 dpi. The starting dilution factor was 1:10. (I) Serum NAbs against SARS-CoV-2 variants were measured with neutralization assays at 4 and 14 dpi. (J) BAL NAbs against the SARS-CoV-2 variants were determined with neutralization assay at 4 and 14 dpi. Dots represent individual hamsters (4 dpi, n=6; 14 dpi, n=9 or 10). For (E-J), the horizontal dotted lines represent the LOD of the assays. For (B-D), statistical analyses were performed by two-way ANOVA; error bars represent mean ± s.e.m. For (E, F), statistical analyses were performed by two-way ANOVA; error bars represent geometric mean with geometric SD. For (G-J), statistical analyses were performed by Mann-Whitney test, two-tailed; error bars represent geometric mean with geometric SD. *p<0.05, **p<0.01, ***p<0.001, ****p<0.0001, and ns, not significant. Data represent one independent animal experiment with indicated biological replicates.

