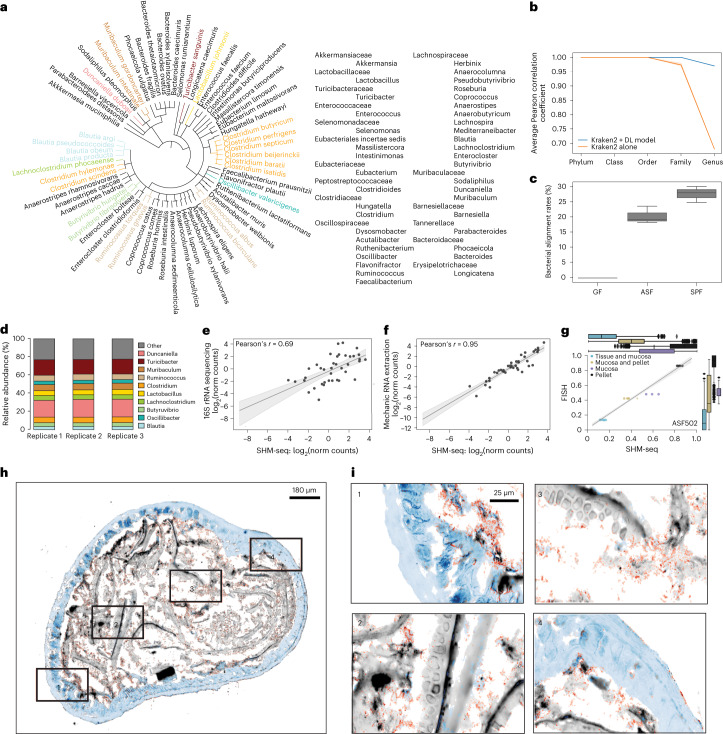
Fig. 2. SHM-seq accurately captures bacterial representation and abundances in SPF and ASF mice.
a, Bacterial reference of the mouse gut microbiome. Phylogenetic tree of SPF colonic content, representing the 65 species colored to highlight taxonomic families and genera. b, Enhanced annotation performance of the deep learning model. Average Pearson correlation coefficient (y axis) between true and predicted taxonomic labels from spatial spots (Methods) on five taxonomic levels (x axis) when using Kraken2 (orange) or Kraken2 together with the deep learning model (blue) (y axis) (n = 3). Error bars: 95% confidence intervals. c, Highly specific mapping of bacterial reads. Overall bacterial alignment rates to reference genomes (y axis, %) for GF (left, n = 3), ASF (middle, n = 3) and SPF (right, n = 3) tissue sections using spatial 16S sequencing. d, High reproducibility of bacterial abundances in SPF mouse colons by SHM-seq. Percentage (y axis) of the top 10 most abundant bacteria genera in each of three independent samples of SPF mouse colons (x axis). e, SHM-seq compares well to 16S rRNA sequencing. Pseudo-bulk abundances of bacterial genera (dot) from SHM-seq (x axis, SPF mice, n = 3) and bulk 16S rRNA sequencing62 (y axis, SPF mice, n = 3). Top left: Pearson r. f, Enzymatic (SHM-seq) extraction of bacterial content agrees with established mechanic extraction. Pseudo-bulk abundances of each bacterial genera (dot) from SHM-seq (x axis, SPF mice, n = 3) and mechanical extraction (y axis, SPF mice, n = 3). g–i, SHM-seq agreement with FISH probes targeting ASF502. g, Distribution (box plot, normalized signals per region) and individual measurements (scatter plot, mean signal per region and sample, n = 6) of ASF502 counts by FISH (y axis) and SHM-seq (x axis). Shaded areas: 95% confidence interval. c,g, Box plots: center black line, median; color-coded box, interquartile range; error bars, 1.5× interquartile range; black dots; outliers. h, Cross-section of an ASF mouse colon (scale bar, 180 μm) with four regions (red rectangles) and their zoom-ins (i) (scale bar, 25 μm). Colors: tissue (blue), fibers (gray) and ASF502 (red). e,f, Line: linear regression model fit. Shaded areas: 95% confidence interval. norm, normalized; DL, deep learning.

