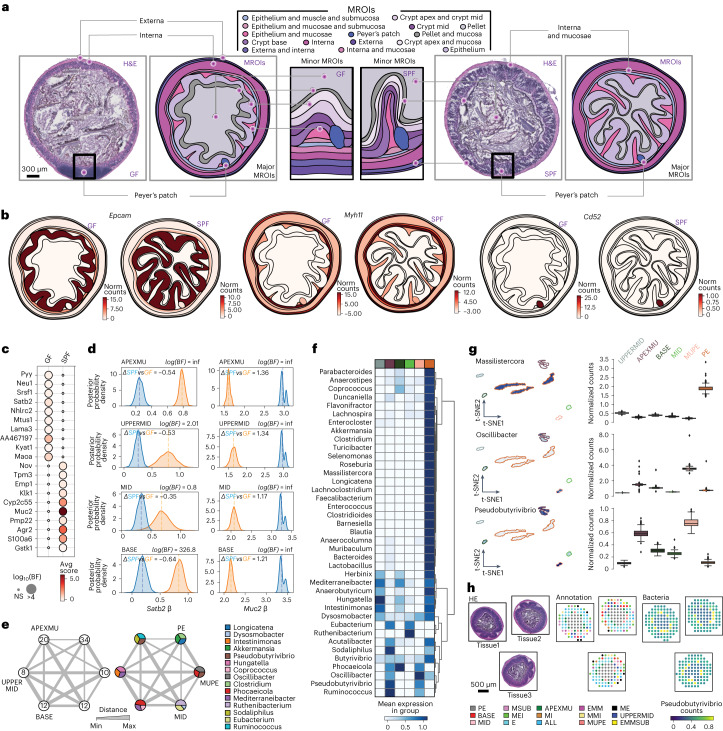
Fig. 3. Spatial detection of bacteria and host gene expression with SHM-seq.
a, MROI in the mouse colon. H&E-stained tissue sections from GF (left) and SFP (right) mice (left panels) annotated and visualized with vector representations (right panels), showing bacteria and host expression in major and minor MROIs associated with each anatomical tissue layer (right panels). Scale bar, 300 μm. b, Spatial host gene expression in three major MROIs. Expression (color bar, normalized gene expression) of selected spatially variable genes in GF (left) and SPF (right) tissue sections in major MROIs. c, Differential gene expression between mouse conditions. Significance (dot size, log10BF; Methods) of differential expression and expression level (normalized gene expression) of the top 10 genes (rows) differentially expressed between GF and SPF mouse tissue sections (columns) (Methods). d, Gene expression differences between morphological regions. Posterior distributions of the region-specific coefficient parameters (β) of Satb2 (left) and Muc2 (right) in four MROIs describing colonic crypts in SPF (blue) and GF (orange) mice. Dashed lines: mean of each distribution. e, Bacteria detected across six MROIs in SPF mouse tissues. Number of (left) and top three most abundant (right) bacteria genera (color code) detected in minor MROIs. Line thickness: average Euclidean distances between MROIs. f, Regional abundance of taxa. Scaled normalized bacterial counts (normalized counts scaled within each genus, color bar) in MROIs (color code, columns) for each detected bacteria (rows). g, Association between taxa and spatial regions. t-distributed stochastic neighbor embedding (t-SNE) of scaled bacterial count profile of each spatial spot (color scale, dots, n = 4,655, left panel) and the distribution of normalized bacterial count for all spatial spots (right panel) in six minor MROIs (color code) in SPF mice for different genera. Boxplots: Center black line, median; color-coded box, interquartile range; error bars, 1.5x interquartile range; black dots; outliers. h, Reproducibility of bacterial associations across individual sections. H&E (left), MROI annotations (color code, middle) and normalized bacterial count for Pseudobutyrivibrio (color scale, right) in three tissue sections. Circles: spatial spots. Scale bar, 500 μm. Abbreviations as in Methods (c–h). MROI color code shared (f,g). Norm, normalized; NS, not significant; inf, infinity.

