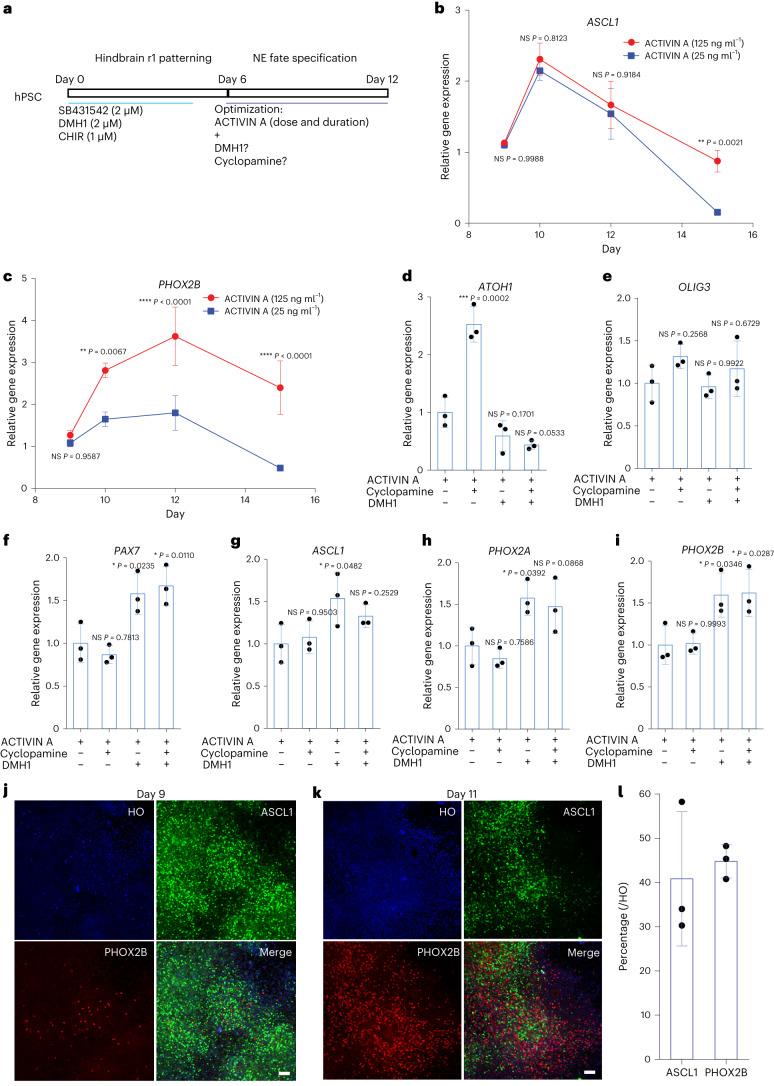
Fig. 3. Temporal and concentration effects of ACTIVIN A on the expression of ASCL1 and PHOX2A/2B.
a, Experimental design to optimize NE progenitor fate specification at the second stage of differentiation. CHIR, CHIR99021. b,c, qPCR of ASCL1 and PHOX2B expression under 25 ng ml−1 and 125 ng ml−1 ACTIVIN A from day 9 to day 15. Data are shown as mean ± s.d. n = 3 biologically independent samples for each condition. The significance (comparison between 25 ng ml−1 and 125 ng ml−1 at the same timepoint) was assessed by two-way ANOVA (Sidak’s multiple comparisons test). *P < 0.05, **P < 0.01, ***P < 0.001 and ****P < 0.0001. NS, not significant. d–f, Expression of dorsal markers ATOH1, OLIG3 and PAX7 under the treatment of ACTIVIN A with or without DMH1/cyclopamine. Data are shown as mean ± s.d. n = 3 biologically independent samples for each condition. The significance (versus the first condition) was assessed by one-way ANOVA (Dunnett’s multiple comparisons test). *P < 0.05, **P < 0.01, ***P < 0.001 and ****P < 0.0001. g–i, Expression of NE progenitor marker genes ASCL1, PHOX2A and PHOX2B under the treatment of ACTIVIN A with or without DMH1/cyclopamine. Data are shown as mean ± s.d. n = 3 biologically independent samples for each condition. The significance (versus the first condition) was assessed by one-way ANOVA (Dunnett’s multiple comparisons test). *P < 0.05 and **P < 0.01. j–l, Immunostaining of NE progenitor markers ASCL1 and PHOX2B at day 9 (j) and day 11 (k) during differentiation under the opimized condition and their quantification. Scale bar in j,k, 50 µm. l, HO, Hoechst. Data are shown as mean ± s.d. n = 3 biologically independent samples for each condition.

