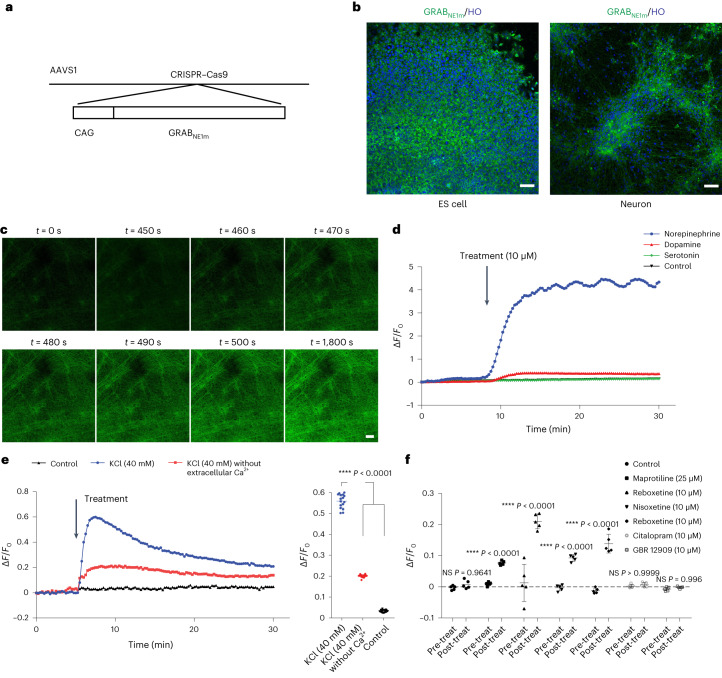
Fig. 6. Generation and testing of the NE sensor cells.
a, Schematic diagram of experimental design for generating the cell line expressing NE sensor GRABNE1m. b, GRABNE1m expression in ESCs and ESC-derived NE neurons. HO, Hoechst. Scale bar, 50 µm. c, Time-lapse of GRABNE1m fluorescence under the treatment of NE. Scale bar, 50 µm. d, GRABNE1m fluorescence intensity along NE (10 µM), DA (10 µM) and serotonin (10 µM) treatment. ΔF/F0 refers to the peak change in fluorescence intensity. The control group overlaps with the serotonin group in the panel. e, GRABNE1m fluorescence intensity along KCl (40 mM) admininstration with or without extracellular calcium. n = 16 biologically independent fields for each condition. Significance (versus KCl condition) was assessed by one-way ANOVA (Dunnett’s multiple comparisons test). ****P < 0.0001. f, Comparison of fluorescence intensity before and after drug administration. Data are shown as mean ± s.d. n = 5 biologically independent samples for both pre-treatment and post-treatment in each condition. Significance was assessed by two-way ANOVA (Sidak’s multiple comparisons test). The comparison is between pre-treatment and post-treatment in each condtion. *P < 0.05, **P < 0.01,***P < 0.001 and ****P < 0.0001. NS, not significant.

