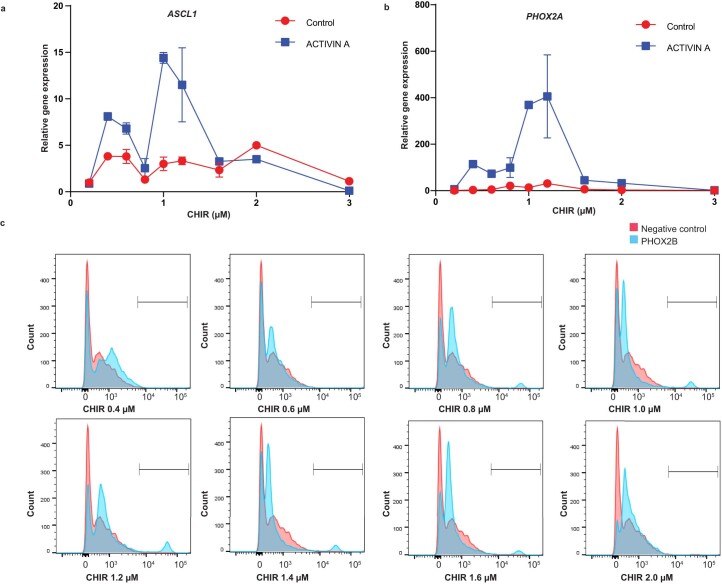
Extended Data Fig. 2. Regional dependent effect of ACTIVIN A.
a, b, qPCR of ASCL1 and PHOX2A expression under ACTIVIN A treatment (2nd week) following a series of CHIR99021(CHIR) concentrations at the first week. Data are shown as mean ± s.e.m. n = 3 biologically independent samples for each condition. c, Flow cytometry quantification of PHOX2B positive cell population from cells treated with ACTIVIN A after being pre-treated with a series of CHIR concentrations.

