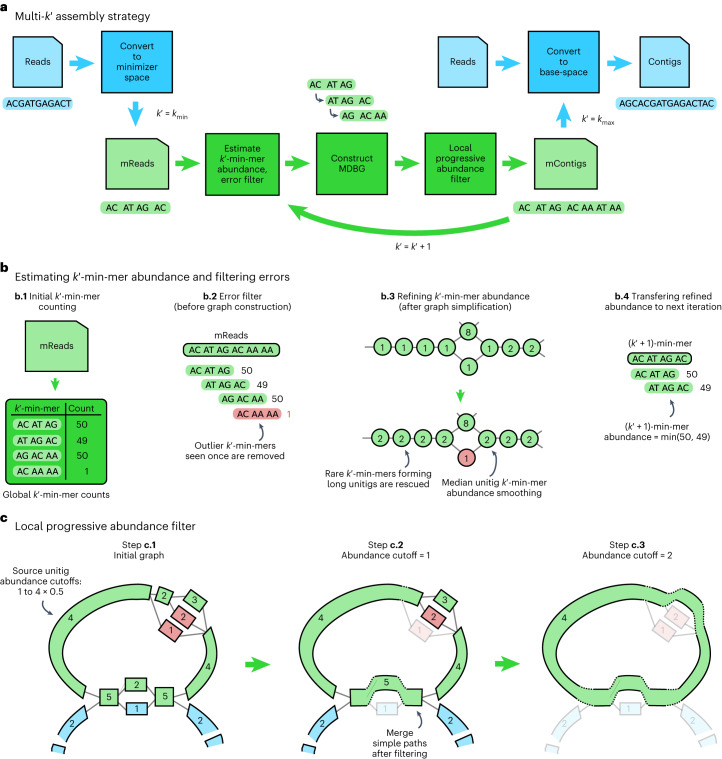
Fig. 1. Overview of the algorithmic steps of metaMDBG.
a, Overview of the multi- assembly strategy. Processes in blue are performed at the level of nucleotide sequences and those in green are performed only at the level of minimizers. b, Components for estimating and refining -min-mer abundance as is increased and for filtering errors before graph construction. c, Illustration of the 'local progressive abundance filter' algorithm that simplifies complex graph regions generated by errors, inter-genomic repeats and strain variability. Each node represents a unitig (unitigs in green and blue belong to two distinct species and unitigs in red represent errors). The long unitig (with abundance = 4) is chosen as the seed (step c.1). Its abundance is used as a reference to apply a 'local progressive abundance filter' from 1× to 0.5× its abundance (steps c.2 and c.3). At each step, unitigs with abundance equal to the cutoff value are removed and the graph is re-compacted to simplify fragmented unitigs. Note that fragmented green unitigs with abundance = 2 would have been removed without the intermediate step c.2.

