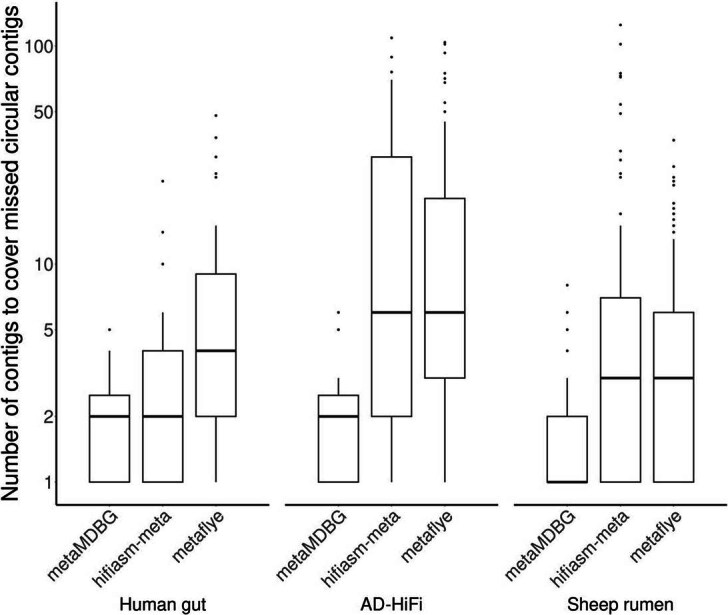
Extended Data Fig. 1. Number of contigs required to cover a near-complete circular MAG reconstructed successfully by an alternative assembler.

In order to estimate the degree of fragmentation of assemblers, we aligned the contigs of one assembler against the near-complete circular contigs (cMAGs) recovered by the other assemblers. The fragmentation is then represented as the number of contigs required to cover these cMAGs (see section ‘Assessment of completeness and fragmentation of assemblies using reference sequences’ for details). The boxplot elements are the median (horizontal bar), 25th and 75th percentiles (box limits Q1 and Q3), Q1-1.5*IQR and Q3+1.5*IQR (whiskers, IQR=Q3-Q1) and outliers. Summary statistics (n, min, median, mean, max): Human gut- metaMDBG (19, 1, 2, 2.1, 5); hifiasm-meta (32, 1, 2, 4, 24); metaFlye (68, 1, 4, 7.5, 48) : AD-HiFi- metaMDBG (11, 1, 2, 2.3, 6); hifiasm-meta (72, 1, 6, 19.8, 109); metaFlye (105, 1, 6, 15.1, 104) : Sheep rumen- metaMDBG (15, 1, 1, 1.8, 8); hifiasm-meta (18, 1, 3, 10.7, 125); metaFlye (183, 1, 3, 5, 37). The data to generate this boxplot have been extracted from Supplementary Table S5.
