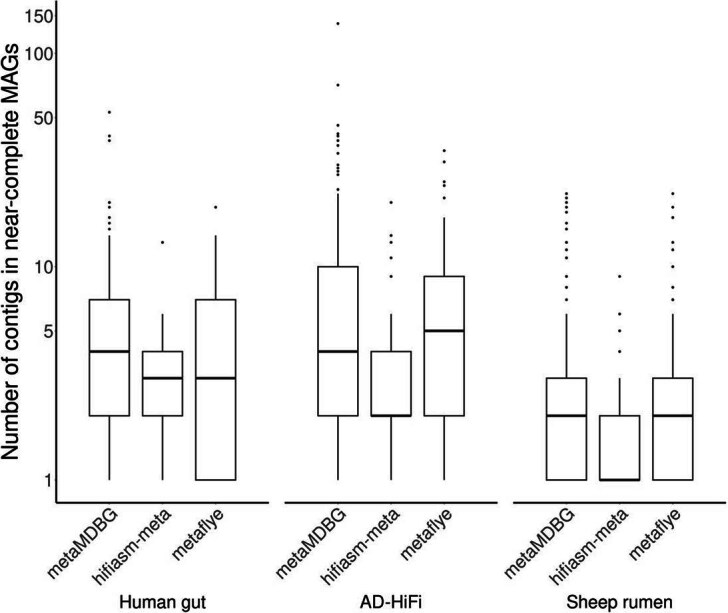
Extended Data Fig. 3. Number of contigs in non-circular near-complete MAGs.

The boxplot elements are the median (horizontal bar), 25th and 75th percentiles (box limits Q1 and Q3), Q1-1.5*IQR and Q3+1.5*IQR (whiskers, IQR=Q3-Q1) and outliers. Summary statistics (n, min, median, mean, max): Human gut- metaMDBG (90, 1, 4, 6.8, 53); hifiasm-meta (67, 1, 3, 3.1, 13); metaFlye (65, 1, 3, 4.6, 19) : AD-HiFi- metaMDBG (174, 1, 4, 9.2, 138); hifiasm-meta (47, 1, 2, 3.6, 20); metaFlye (107, 1, 5, 7, 35) : Sheep rumen-metaMDBG (181, 1, 2, 3.3, 22); hifiasm-meta (137, 1, 1, 1.5, 9); metaFlye (186, 1, 2, 2.8, 22). The data to generate this boxplot have been extracted from Supplementary Table S5.
