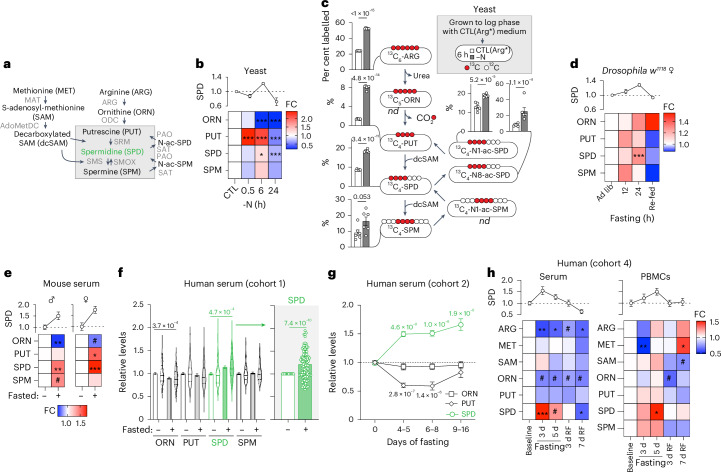
Fig. 1. Fasting induces polyamine synthesis in various species.
a, Schematic overview of the polyamine pathway and adjacent metabolites. AdoMetDC, adenosylmethionine decarboxylase; ARG, arginase; MAT, methionine adenosyltransferase; ODC, ornithine decarboxylase; SAT, SPD/SPM acetyltransferase, SRM, spermidine synthase; SMOX, spermine oxidase; SMS, spermine synthase; PAO, polyamine oxidase. b, Polyamine levels of WT BY4741 yeast shifted to nitrogen-deprived medium (−N) for the indicated times. Data are normalized to the mean of the control (CTL) condition at every time point. Note that the statistics were performed together with additional groups as indicated in Supplementary Fig. 1a. n = 6 biologically independent samples (yeast cultures). c, WT BY4741 yeast cells were pre-labelled with 13C6-arginine [CTL(Arg*)] and shifted to CTL(Arg*) or −N medium for 6 h. MS-based analysis of labelled products revealed a uniform increase in percentage of labelled polyamines in N-starved cells. nd, not detected. n = 6 biologically independent samples (yeast cultures). d, Polyamine levels of young female w1118 flies fasted for 12 or 24 h (starting at 20:00 upon lights turned off). Data are normalized to the ad libitum (ad lib) group at every time point. Re-fed, 12 h re-feeding after 24 h fasting. n = 5 (re-fed, 24 h ad lib ORN), 6 (24 h ad lib PUT, SPD and SPM), 7 (rest) biologically independent samples (groups of flies). e, Serum polyamine levels of young male and female C57BL/6 mice fasted or kept ad lib for 14–16 h overnight, starting at 16:00–17:00). n = 5 (male), 8 (female) mice. f, Relative polyamine levels in human serum from cohort 1 after fasting (9 (7–13) days) depicted as mean with s.e.m. and violin plots, showing median and quartiles as lines. The extra panel depicts the individual increase in SPD levels for every volunteer. n = 104 (PUT), 109 (SPD baseline), 100 (SPM baseline), 105 (SPD fasted), 94 (SPM fasted) volunteers. g, Relative polyamine levels in human serum from cohort 2 after increasing numbers of fasting days. n = 61 (baseline PUT), 62 (baseline ORN and SPD), 22 (4–5 d PUT and SPD), 25 (4–5 d ORN, 6–8 d ORN), 19 (6–8 d PUT), 20 (6–8 d SPD), 9 (9–16 d PUT and SPD), 13 (9–16 d ORN) volunteers. h, Relative polyamine and precursor levels in human serum and PBMCs from cohort 4 after increasing numbers of fasting days. BL, baseline, RF = days 3 or 7 after re-introduction of food. N (serum) = 7 (BL SAM), 11 (3 d SAM), 12 (7d RF SAM), 13 (5d SAM), 14 (BL PUT and SPD), 15 (BL ARG and MET; 5 d ARG; 3d RF SAM), 16 (BL ORN; 5 d MET, ORN, PUT and SPD), 17 (3 d ARG, MET, ORN, PUT and SPD; 7 d RF ARG, MET, ORN, PUT and SPD), 18 (3 d RF ARG, MET, ORN, PUT and SPD) volunteers. N (PBMCs) = 6 (5 d ORN), 7 (5 d rest), 9 (BL SPD), 10 (BL rest), 11 (3 d RF SPD) 12 (3 d SPD and SPM; 3 d RF rest), 13 (3 d rest; 7 d RF) volunteers. Statistics used were two-way analysis of variance (ANOVA) with Holm-Šídák’s multiple comparisons test (b,d,f,h) and two-tailed Student’s t-tests (c). For every analyte (e) two-way ANOVA with false discovery rate (FDR) correction (two-stage step-up method by Benjamini, Krieger and Yekutieli, Q = 0.05) together with data depicted in Extended Data Fig. 1f–i (male) and Extended Data Fig. 1k–n (female). Wilcoxon matched-pairs signed rank test (f). Kruskal–Wallis test with Dunn’s multiple comparison test (g). FC, fold change to control. Heatmaps show means. Bar and line graphs show mean ± s.e.m. *P < 0.05, **P < 0.01, ***P < 0.001, #P < 0.2. Source numerical data are available in source data.

