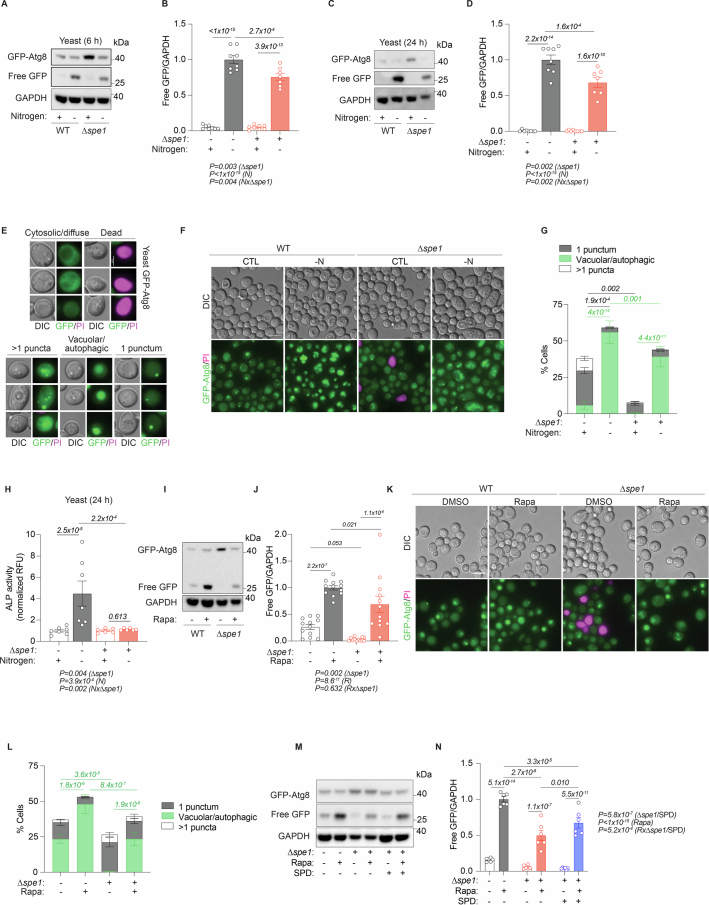
Extended Data Fig. 4. SPE1, the yeast ODC1 homologue, is required for starvation- and rapamycin-induced autophagy.
(a) Representative immunoblots of yeast WT and ∆spe1 GFP-Atg8 after 6 hours -N, assessed for GFP and GAPDH. (b) Quantifications of [B]. N = 7(∆spe1 -N), 8 (rest) biologically independent samples (yeast cultures). (c) Representative immunoblots of yeast WT and ∆spe1 GFP-Atg8 after 24 hours -N, assessed for GFP and GAPDH. (d) Quantifications of [C]. N = 7(∆spe1 -N), 8(rest) biologically independent samples (yeast cultures). (e) Representative images of the categories used for categorization of GFP-Atg8 signals as shown and quantified in [F-G]. DIC = differential interference contrast, PI = propidium iodide staining for dead cells. (f) Representative images of yeast WT and ∆spe1 GFP-Atg8 cells 6 hours after -N. Scale bar = 5 µm. (g) Blinded manual quantification of the autophagic status in microscopy images of WT and ∆spe1 GFP-Atg8 cells 6 hours after -N. N = 6 biologically independent samples (yeast cultures). (h) ALP activity (RFU/µg) from Pho8∆N60 assay normalized to each CTL group after 24 hours -N. N = 7(WT), 6(∆spe1) biologically independent samples (yeast cultures). (i) Representative immunoblots of yeast WT and ∆spe1 GFP-Atg8 after 6 hours rapamycin treatment (40 nM), assessed for GFP and GAPDH. (j) Quantifications of [I]. N = 12 biologically independent samples (yeast cultures). (k) Representative images of yeast WT and ∆spe1 GFP-Atg8 cells 6 hours after rapamycin (40 nM) treatment. Scale bar = 5 µm. (l) Blinded manual quantification of the autophagic status in microscopy images of WT and ∆spe1 GFP-Atg8 cells 6 hours after rapamycin (40 nM) treatment. N = 6 biologically independent samples (yeast cultures). (m) Representative immunoblots of yeast WT BY4742 and ∆spe1 GFP-Atg8 after 6 hours rapamycin treatment (40 nM), with and without 100 µM SPD, assessed for GFP and GAPDH. (n) Quantifications of [M]. N = 6 biologically independent samples (yeast cultures). Statistics: Two-way ANOVA with Holm-Šídák’s multiple comparisons test. Bar graphs show the mean ± s.e.m. Source numerical data and unprocessed blots are available in source data.

