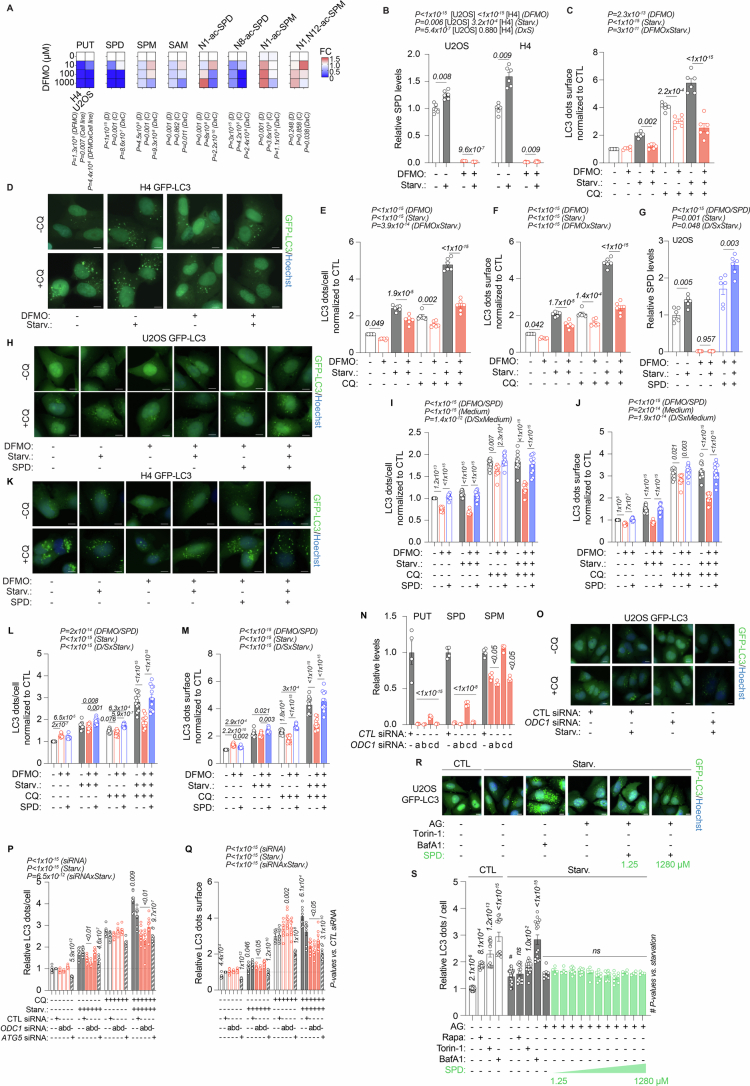
Extended Data Fig. 5. ODC1 is required for starvation-induced autophagy in H4 and U2OS cells.
(a) DFMO treatment (48 hours, 100 µM) affects the polyamine profile of H4 and U2OS cells in vitro. Polyamine levels normalized to cell line-specific control (0 µM DFMO). N = 5(H4 0, 100 µM DFMO), 4(rest) biologically independent samples. (b) SPD levels in DFMO-treated (48 hours, 100 µM) U2OS and H4 cells after 6 hours starvation. N = 6 biologically independent samples. (c) Quantification of surface area covered by GFP-LC3 dots in 6 hours starved U2OS GFP-LC3 cells treated with or without 100 µM DFMO for 3 days, as depicted in Fig. 3m, normalized to the control condition. N = 6 biologically independent experiments. (d) Representative images of human H4 GFP-LC3 cells starved for 3 hours in HBSS (with or without chloroquine [CQ] for 1.5 hours before fixation) after three days of 100 µM DFMO treatment. Scale bar = 10 µm. (e, f) Quantification of cytosolic GFP-LC3 dots and surface area covered by GFP-LC3 dots from [D], normalized to the control condition. N = 6 biologically independent experiments. (g) SPD levels in U2OS cells treated with DFMO (100 µM) and SPD (10 µM) after 6 hours of starvation. Aminoguanidine (1 mM) was added to all conditions. N = 6 biologically independent samples. (h-j) Representative images and quantifications of human U2OS GFP-LC3 cells starved for 6 hours in HBSS (with or without chloroquine [CQ] for 3 hours before fixation) after three days of 100 µM DFMO treatment in combination with or without 10 µM SPD. Aminoguanidine (1 mM) was added to all conditions. Scale bar = 10 µm. N = 12 biologically independent experiments. (k-m) Representative images and quantifications of human H4 GFP-LC3 cells starved for 3 hours in HBSS (with or without CQ for 1.5 hours before fixation) after three days of 100 µM DFMO treatment in combination with or without 10 µM SPD. Aminoguanidine (1 mM) was added to all conditions. Bar = 10 µm. N = 12 biologically independent experiments. (n) Polyamine levels are depleted 48 hours after ODC1 knockdown via siRNAs in U2OS cells. N = 4 biologically independent samples. (o-q) Representative images and quantifications of human U2OS GFP-LC3 cells starved for 6 hours in HBSS (with or without CQ for 3 hours before fixation) after three days of ODC1 knockdown. Scale bar = 10 µm. N = 8 biologically independent experiments. (r, s) Representative images and quantifications of human U2OS GFP-LC3 cells starved for 6 hours in HBSS or treated with Rapamycin (10 µM) or Torin-1 (300 nM). SPD was added in ascending concentrations to test for synergistic effects with starvation. AG = aminoguanidine (1 mM). N = 4(Starv.+AG + 1.25, 2.5, 320, 640, 1280 µM SPD), 8(Starv.+AG; Starv+AG + 5-160 µM SPD), 16(Rapa, Torin-1, BafA1), 32(CTL) biologically independent samples. Statistics: [A-C,E-G,I-J,L-N,P-Q] Two-way ANOVA with Holm-Šídák’s multiple comparisons test. [S] One-way ANOVA with Holm-Šídák’s multiple comparisons test Heatmaps show means. Bar graphs show the mean ± s.e.m. Source numerical data are available in source data.

