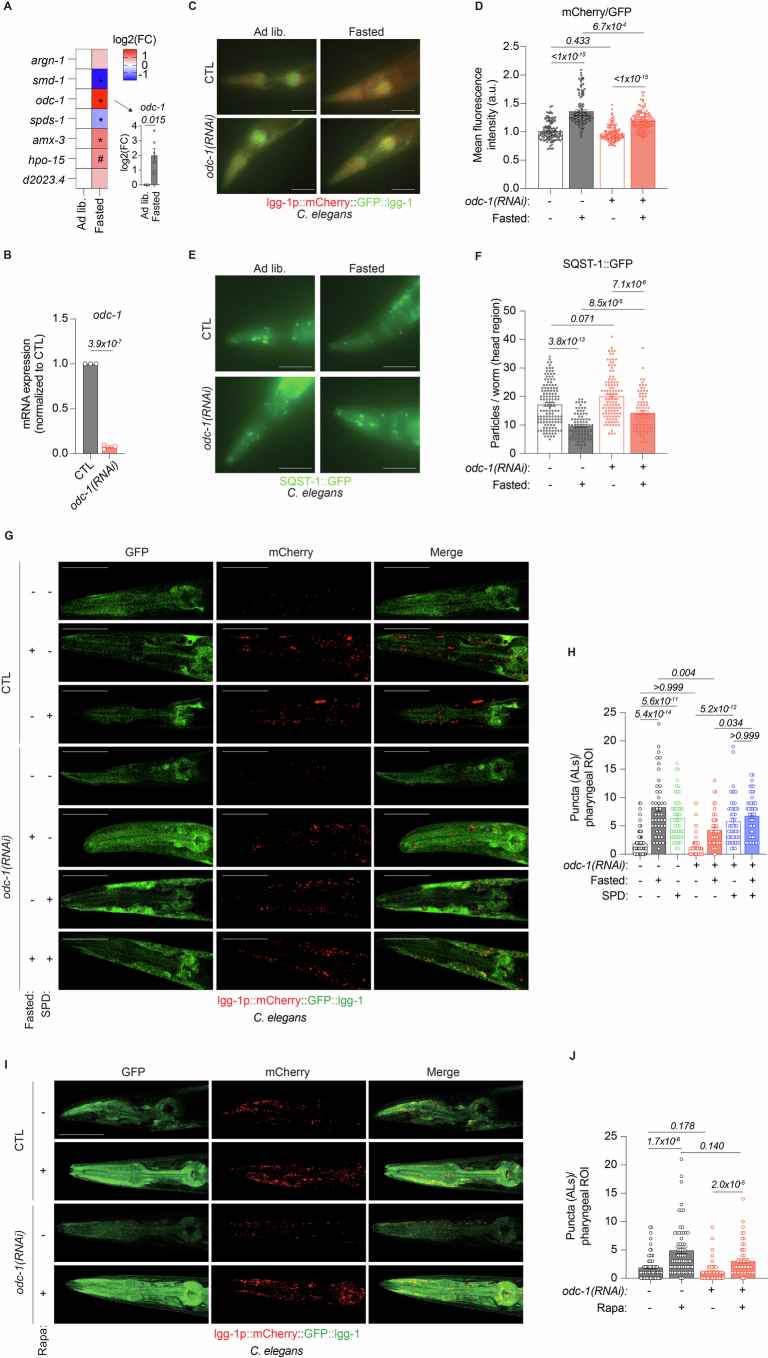
Extended Data Fig. 6. Fasting-induced autophagy in worms requires odc-1.
(a) Relative mRNA expression levels of polyamine-relevant genes in 24 hours fasted C. elegans. N = 4(hpo-15), 5(argn-1, smd-1, amx-3, d2023.4), 6(odc-1, spds-1) biologically independent experiments. (b) Knockdown efficiency of odc-1 mRNA by feeding bacteria expressing odc-1(RNAi) for 3 days in C. elegans. N = 3 biologically independent experiments. (c) Representative fluorescence images of the head region of young C. elegans MAH215 (sqIs11 [lgg-1p::mCherry::GFP::lgg-1 + rol-6]) fasted for two days and fed control or odc-1(RNAi) expressing bacteria. Autophagic activity is indicated by a shift to the red spectrum due to fluorescence quenching of the pH-sensitive-GFP by the acidic environment of the autolysosome. Scale bar = 50 μm. (d) Quantification of the ratio of the mean fluorescence intensity of mCherry/GFP signals, as depicted in [C]. Note that the experiment and statistics were performed together with the dhps-1(RNAi) groups in Extended Data Fig. 10e. N = 121(CTL ad lib), 127(CTL fasted), 113(Odc-1(RNAi) ad lib), 125(Odc-1(RNAi) fasted) worms. (e) Representative fluorescence images of the head region of young C. elegans SQST-1::GFP fasted for two days and fed control or odc-1(RNAi). Autophagic activity is indicated by a decrease in the number of GFP-positive particles. Scale bar = 50 μm. (f) Quantification of the SQST-1::GFP particles in the head region, as depicted in [E]. Note that the experiment and statistics were performed together with the dhps-1(RNAi) groups in Extended Data Fig. 10g. N = 133(CTL ad lib), 86(CTL fasted), 109(odc-1(RNAi) ad lib), 86(odc-1(RNAi) fasted) worms. (g) Representative images of the head region of young C. elegans MAH215 (sqIs11 [lgg-1p::mCherry::GFP::lgg-1 + rol-6]) fasted for two days and fed control or odc-1(RNAi) with and without 0.2 mM SPD. Autolysosomes (ALs) appear as mCherry-positive puncta. Scale bar = 50 μm. (h) Quantification of ALs as depicted in [G]. N = 63(CTL), 42(CTL fasted), 52(CTL + SPD), 54(odc-1(RNAi)), 48(odc-1(RNAi) fasted), 50(odc-1(RNAi)+SPD, odc-1(RNAi)+SPD fasted) worms. (i) Representative images of the head region of young C. elegans MAH215 (sqIs11 [lgg-1p::mCherry::GFP::lgg-1 + rol-6]) with or without 50 µM rapamycin and fed control or odc-1(RNAi). Autolysosomes (ALs) appear as mCherry-positive puncta. Scale bar = 50 μm. (j) Quantification of ALs as depicted in [I]. N = 63(CTL), 62(CTL+Rapa), 54(odc-1(RNAi)), 53(odc-1(RNAi)+Rapa) worms. Statistics: [A] Mann-Whitney with Holm-Šídák’s multiple comparisons test. [B] Two-tailed Student’s t-test. [D,F,H,J] Kruskal-Wallis test with Dunn’s multiple comparison test. Heatmaps show means. Bar graphs show the mean ± s.e.m. * P < 0.05, # P < 0.2. Source numerical data are available in source data.

