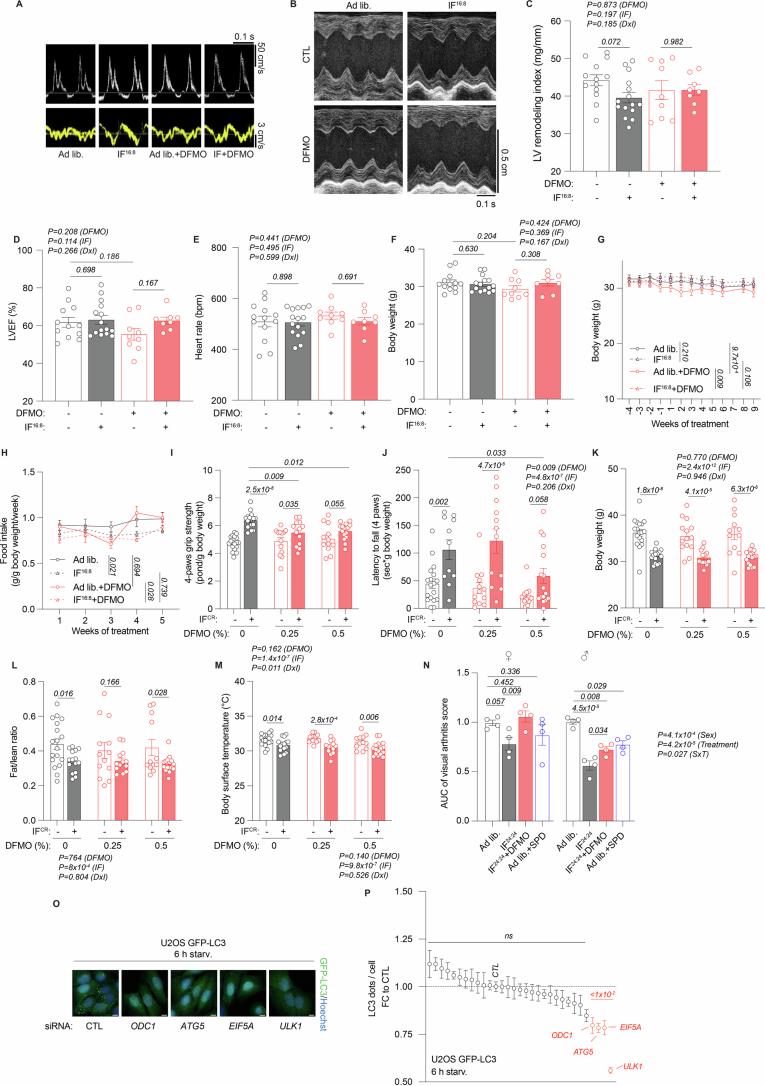
Extended Data Fig. 8. Cardiac profiling by echocardiography of aging mice during IF, with and without DFMO.
(a) Representative echocardiography-derived mitral pulsed wave and tissue Doppler tracings in aged mice treated as outlined in Fig. 5a. (b) Representative echocardiography derived left ventricular (LV) M-mode tracings. (c) LV remodelling index. N = 13(Ad lib), 15(IF), 9(Ad lib + DFMO), 8(IF + DFMO) mice. (d) LV ejection fraction (LVEF). N = 12(Ad lib), 15(IF), 9(Ad lib + DFMO), 8(IF + DFMO) mice. (e) Heart rate. N = 13(Ad lib), 15(IF), 9(Ad lib + DFMO), 8(IF + DFMO) mice. (f) Body weight at the time of cardiac profiling. N = 13(Ad lib), 15(IF), 9(Ad lib + DFMO), 8(IF + DFMO) mice. (g) Body weight throughout the intervention. N = 15(Ad lib; Ad lib + DFMO),16(IF; IF + DFMO IF) mice (at week 0). (h) Food intake per mouse throughout the intervention. N = 3(Week 4 IF + DFMO), 4(rest) cages. (i) Grip strength (all limbs) normalized to body weight. N = 18(CTL ad lib), 15(CTL IF), 13(0.25% DFMO), 12(0.5% DFMO ad lib), 16(0.5% DFMO IF) mice. (j) Latency to fall in a 4-limb grid hanging test. N = 18(CTL ad lib), 11(CTL IF), 13(0.25% DFMO ad lib), 12(0.25% DFMO IF), 12(0.5% DFMO ad lib), 16(0.5% DFMO IF) mice. (k) Body weight. N = 18(CTL ad lib), 15(CTL IF), 14(0.25% DFMO ad lib), 13(0.25% DFMO IF), 12(0.5% DFMO ad lib), 16(0.5% DFMO IF) mice. (l) Fat-to-lean mass ratio. N = 18(CTL ad lib), 15(CTL IF), 13(0.25% DFMO), 12(0.5% DFMO ad lib), 16(0.5% DFMO IF) mice. (m) Abdominal surface temperature. N = 18(CTL ad lib), 15(CTL IF), 14(0.25% DFMO ad lib), 13(0.25% DFMO IF), 12(0.5% DFMO ad lib), 16(0.5% DFMO IF) mice. (n) Sex-stratified arthritis scoring of data presented in Fig. 5h-i upon injection of serum from K/BxN mice in young male and female BALB/cJRj mice treated as outlined in Fig. 5g. N = 4 mice. (o) Genes previously connected to the cellular effects of SPD were knocked out via siRNAs in U2OS GFP-LC3 cells and tested for starvation-induced autophagy. Selected representative images after 6 hours of starvation. (p) 48 hours after siRNA knockdown, U2OS GFP-LC3 cells were starved for 6 hours. The graph depicts the normalized individual FC to control conditions of GFP-LC3 dots for every gene knockdown or control condition (means ± S.E.M.). FC 1 represents the starvation-induced increase in GFP-LC3 dots in the control condition. Highlighted genes were significantly different from the control. N = 17(CTL), (Dharmafect control), 9(rest) biologically independent samples. Statistics: [C-N] Two-way ANOVA with Holm-Šídák’s multiple comparisons test. [P] One-way ANOVA with Holm-Šídák’s multiple comparisons test. Line graph shows the mean ± s.e.m. Bar and line graphs show the mean ± S.E.M. Source numerical data are available in source data.

