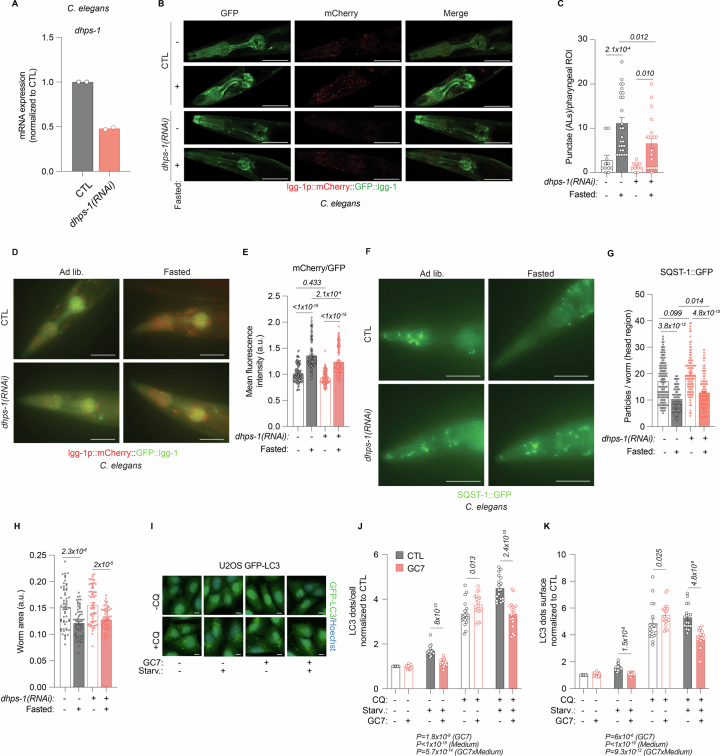
Extended Data Fig. 10. Hypusination is important for fasting-induced autophagy in worms and human cells.
(a) Feeding of dhps-1(RNAi) expressing bacteria reduces dhps-1 mRNA expression in C. elegans N2 worms. N = 2 biologically independent experiments. (b) Representative confocal images of the head region of young C. elegans MAH215 (sqIs11 [lgg-1p::mCherry::GFP::lgg-1 + rol-6]) fasted for two days and fed control or dhps-1(RNAi) expressing bacteria. Autolysosomes (ALs) appear as mCherry-positive puncta. Scale bar = 50 μm. (c) Quantification of ALs as depicted in [B]. Note that the experiment and statistics were performed together with the odc-1(RNAi) groups in Fig. 3p. N = 11(CTL ad lib), 26(CTL fasted), 10(dhps-1(RNAi) ad lib), 21(dhps-1(RNAi) fasted) worms. (d) Representative fluorescence images of the head region of young C. elegans MAH215 (sqIs11 [lgg-1p::mCherry::GFP::lgg-1 + rol-6]) (LGG-1 is the C. elegans ortholog of LGG-1/Atg8) fasted for two days and fed control or dhps-1(RNAi) expressing bacteria. Autophagic activity is indicated by a shift to the red spectrum due to fluorescence quenching of the pH-sensitive-GFP by the acidic environment of the autolysosome. Scale bar = 50 μm. (e) Quantification of the ratio of the mean fluorescence intensity of mCherry/GFP signals, as depicted in [D]. Note that the experiment and statistics were performed together with the odc-1(RNAi) groups in Extended Data Fig. 6d. N = 121(CTL ad lib), 127(CTL fasted), 107(Dhps-1(RNAi) ad lib), 143(Dhps-1(RNAi) fasted) worms. (f) Representative fluorescence images of the head region of young C. elegans SQST-1::GFP fasted for two days and fed control or dhps-1(RNAi) expressing bacteria. Autophagic activity is indicated by a decrease in the number of GFP-positive particles. Scale bar = 50 μm. (g) Quantification of the SQST-1::GFP particles in the head region, as depicted in [F]. Note that the experiment and statistics were performed together with the odc-1(RNAi) groups in Extended Data Fig. 6f. N = 133(CTL ad lib), 86(CTL fasted), 108(dhps-1(RNAi) ad lib), 100(dhps-1(RNAi) fasted) worms. (h) Knockdown of dhps-1 does not affect worm size under ad lib or IF conditions. Note that the experiment and statistics were performed together with the odc-1(RNAi) groups in Extended Data Fig. 7g. N = 56(CTL ad lib), 66(CTL IF), 62(dhps-1(RNAi) ad lib), 59(dhps-1(RNAi) IF) worms. (i) Representative images of U2OS GFP-LC3 cells starved in HBSS with or without 100 µM GC7 for 6 hours. CQ was added for 3 hours before fixation. (j-k) Quantifications of [I]. N = 18 biologically independent samples. Statistics: [C,E,G] Kruskal-Wallis-test with Dunn’s correction. [H,J,K] Two-way ANOVA with Holm-Šídák’s multiple comparisons test. Bar graphs show the mean ± s.e.m. Source numerical data are available in source data.

