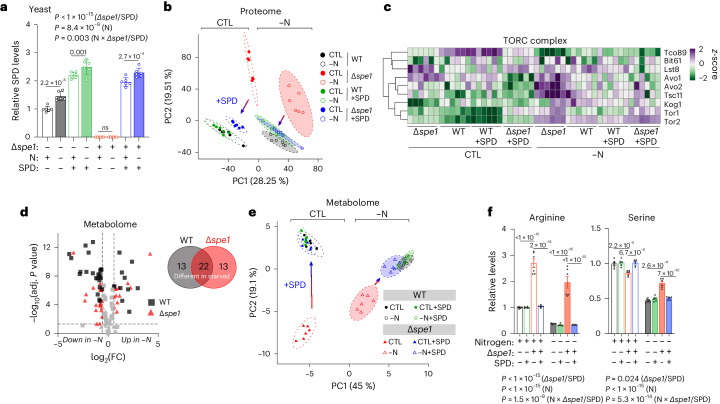
Fig. 2. Spermidine synthesis is required for the cellular adaptation to starvation.
a, Relative SPD levels of WT and ∆spe1 yeast cells after SPD treatment (100 µM) and N starvation. n = 6 biologically independent samples (yeast cultures). b, PCA depicting the proteome change in WT and Δspe1 cells under specified condition treatments following a 6-h culture in control or −N medium with or without 100 µM SPD. PCA was performed on a singular-value decomposition of centred and scaled protein groups (n = 4,684) displays a comparison between PC1 and PC2, along with the representation of a 95% confidence interval for each group. n = 6 biologically independent samples (yeast cultures). c, Differential expression (z-score) of proteins involved in the TORC complex, from the proteome analysis shown in b. n = 6 biologically independent samples (yeast cultures). d, Volcano plot showing significantly different intracellular metabolites in WT or ∆spe1 after 6 h −N compared with control conditions. Venn diagram showing exclusive and overlapping significantly regulated metabolites. FDR-corrected P value < 0.05, FC > 1.5. n = 4 biologically independent samples (yeast cultures). e, Metabolomic disturbances in ∆spe1 cells are rescued by SPD (100 µM) supplementation. The PCA displays a comparison between PC1 and PC2, along with the representation of a 95% confidence interval for each group. n = 6 biologically independent samples (yeast cultures). f, SPD (100 µM) corrects ∆spe1-associated amino acid disturbances. Relative arginine and serine levels from metabolomics analysis shown in e. n = 6 biologically independent samples (yeast cultures). Statistics were two-way ANOVA with Holm-Šídák’s multiple comparisons test (a,f) and two-tailed Student’s t-tests with FDR correction (d). Bar graphs show the mean ± s.e.m. Source numerical data are available in source data.

