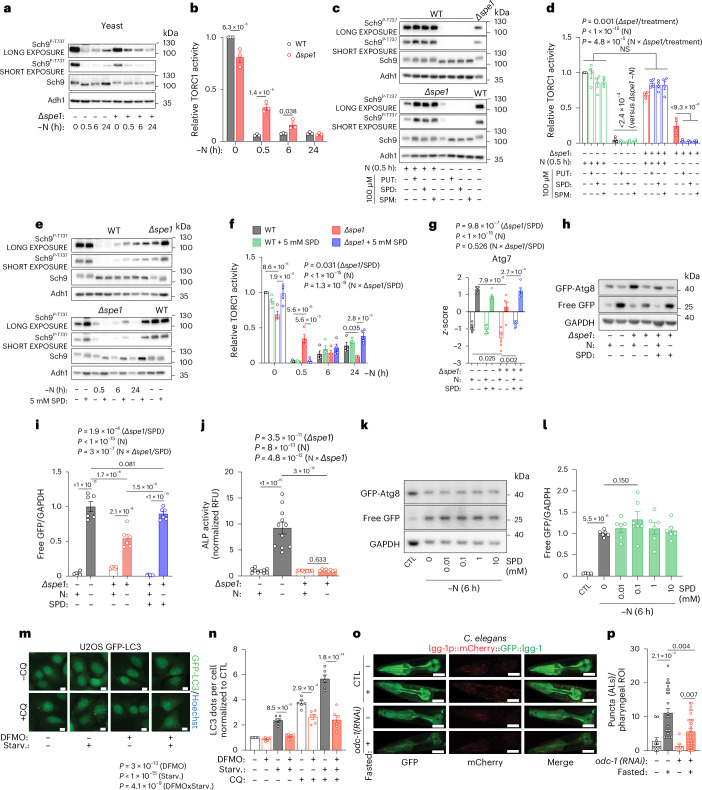
Fig. 3. Autophagy induction is blunted by lack of polyamine synthesis.
a, Decrease of TORC1 activity as inferred by Sch9-phosphorylation during -N in WT and ∆spe1 cells. Representative immunoblot. b, Quantification of immunoblots as shown in a. n = 3 biologically independent samples (yeast cultures). c, Polyamine supplementation (100 µM) corrects the delayed decrease of TORC1 activity during −N in ∆spe1 cells. Representative immunoblot. d, Quantification of immunoblots as shown in c. n = 4 biologically independent samples (yeast cultures). e, Supplementation of high SPD levels (5 mM) corrects the delayed decrease of TORC1 activity in ∆spe1 cells but does not affect TORC1 activity in WT cells. Representative immunoblot. f, Quantification of immunoblots as shown in e. n = 4 biologically independent samples (yeast cultures). g, SPD supplementation (100 µM) corrects decreased Atg7 protein levels ∆spe1 cells in both control and −N medium, as detected in proteome analysis shown in Fig. 2b. n = 6 biologically independent samples (yeast cultures). h, Representative immunoblots of yeast WT and ∆spe1 GFP-Atg8 cells after 6 h −N with and without 100 µM SPD, assessed for GFP and GAPDH. i, Quantifications of h. n = 6 biologically independent samples (yeast cultures). j, ALP activity (RFU per µg) from Pho8∆N60 assay normalized to each CTL group after 6 h −N. n = 10 (WT CTL, ∆spe1 CTL), 11 (WT -N), 8 (∆spe1 −N) biologically independent samples (yeast cultures). k, Representative immunoblots of yeast WT and ∆spe1 GFP-Atg8 after 6 h −N, with or without ascending concentrations of SPD, assessed for GFP and GAPDH. l, Quantifications of k. n = 6 biologically independent samples (yeast cultures). m, Representative images of human U2OS GFP-LC3 cells starved for 6 h in Hanks’ balanced salt solution (HBSS) (with or without chloroquine (CQ) for 3 h before fixation) after 3 days of 100 µM DFMO treatment. For quantifications see also Extended Data Fig. 5c. Scale bar, 10 µm. n, Quantification of cytosolic GFP-LC3 dots from l, normalized to the average number of GFP-LC3 dots in the control condition. n = 6 biologically independent experiments. o, Representative images of the head region of young control and odc-1(RNAi) C. elegans MAH215 (sqIs11 [lgg-1p::mCherry::GFP::lgg-1 + rol-6]) (LGG-1 is the C. elegans orthologue of LC3) fasted for two days. Autolysosomes (ALs) appear as mCherry-positive puncta. Autophagic activity is indicated by a shift to the red spectrum due to fluorescence quenching of the pH-sensitive-GFP by the acidic environment of the autolysosome. Scale bar, 50 μm. p, Quantification of ALs as depicted in o. Note that the statistics were performed together with additional groups as indicated in Extended Data Fig. 10c. n = 11 (CTL ad lib), 26 (CTL fasted), 8 (Odc-1(RNAi) ad lib), 30 (Odc-1(RNAi) fasted) worms. Statistics used were two-way ANOVA with Holm-Šídák’s multiple comparisons test (b,d,f,g,h,j,n), one-way ANOVA with Holm-Šídák’s multiple comparisons test (l) and Kruskal–Wallis test with FDR correction (two-stage step-up method by Benjamini, Krieger and Yekutieli, Q = 0.05) (p). Bar graphs show the mean ± s.e.m. Source numerical data and unprocessed blots are available in source data. NS, not significant.

