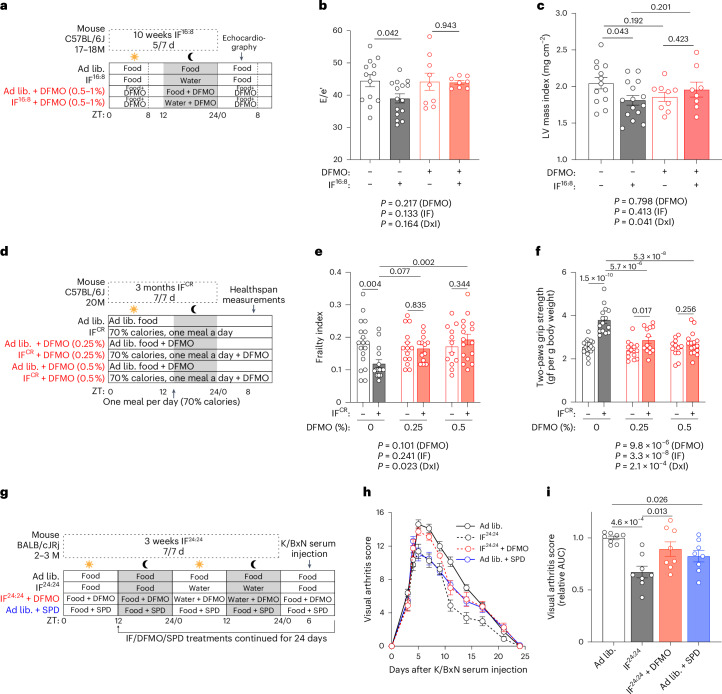
Fig. 5. DFMO blunts the healthspan-promoting effects of IF in mice.
a, Experimental layout to study the effects of DFMO feeding on IF16:8-mediated cardioprotection in 17–18-month-old male C57BL/6J mice. Mice were fasted from 15:00 to 7:00 (16 h daily, excluding weekends). A subset of aged mice received DFMO in the drinking water. After 10 weeks, cardiac function and structure were assessed by echocardiography. Data are shown in b,c, Extended Data Fig. 8a–h and Supplementary Table 3. b, Ratio of peak early Doppler transmitral flow velocity (E) to myocardial tissue Doppler velocity (e′), a measure of diastolic dysfunction, in aged male mice treated with IF16:8, with or without DFMO (n = 13, 15, 9 and 8 mice per group, respectively). c, LV mass normalized to body surface area (LV massi). n = 13 (ad lib), 15 (IF), 9 (ad lib + DFMO), 8 (IF + DFMO) mice. d, Experimental layout to study the effects of DFMO feeding on IFCR-mediated healthspan improvements in 20-month-old male C57BL/6J mice. Mice were given a single meal per day (30% CR) shortly before the dark phase. A subset of mice received 0.25% or 0.5% DFMO in the drinking water. After 3 months, healthspan was assessed. Data are shown in e,f and Extended Data Fig. 8i–m. e, Visual frailty index of aged male mice treated with IFCR, with or without DFMO. n = 12 (ad lib 0.5%), 13 (IF 0.25%), 14 (ad lib 0.25%), 15 (IF 0%), 16 (IF 0.5%), 18 (ad lib 0%) mice. f, Grip strength of fore limbs in gram-force (gf) normalized to body weight of aged male mice treated with IFCR, with or without DFMO. n = 12 (ad lib 0.5%), 13 (IF 0.25%), 14 (ad lib 0.25%), 15 (IF 0%), 16 (IF 0.5%), 18 (ad lib 0%) mice. g, Experimental layout to study the effects of DFMO feeding on IF-mediated anti-inflammatory effects in young BALB/cJRj mice of both sexes. DFMO and 3 mM SPD were supplemented via drinking water. Mice were fasted every other day. IF24:24 and SPD treatments were started 3 weeks before serum transfer and continued until the end of the experiment. Data are shown in h,i and Extended Data Fig. 8n. h, Development of arthritis upon injection of serum from K/BxN mice in young male and female BALB/cJRj mice treated as outlined in g. n = 8 mice. i, AUC analysis of h. n = 8 mice. Statistics used were two-way ANOVA with Holm-Šídák’s multiple comparisons test (b,c,e,f), log-rank test with Bonferroni correction (c,e) and one-way ANOVA with Holm-Šídák’s multiple comparisons test (i). Bar graphs show the mean ± s.e.m. M, months of age. Source numerical data are available in source data.

