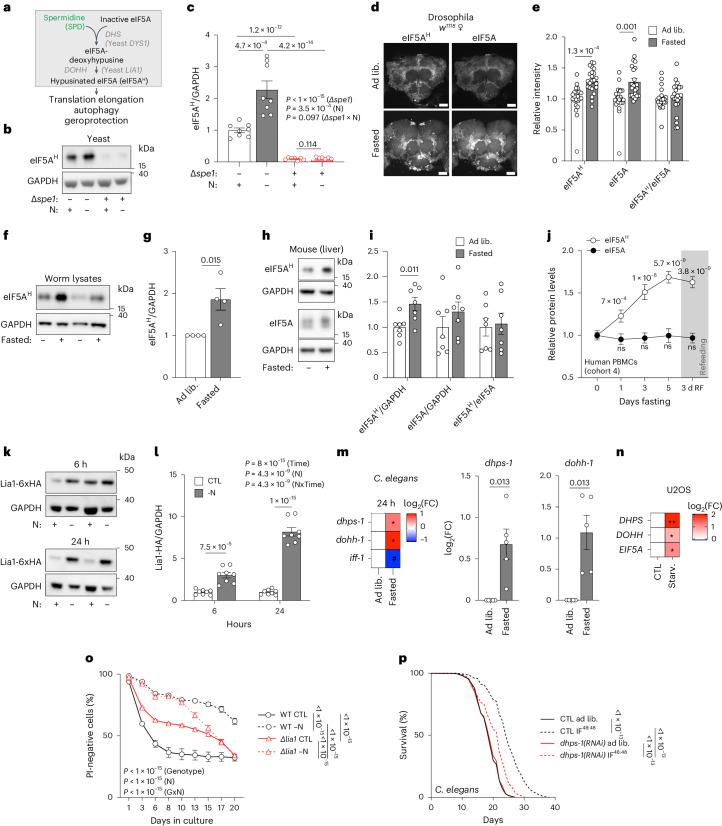
Fig. 6. Hypusination of eIF5A acts downstream of spermidine to mediate IF-associated longevity.
a, Scheme of the hypusination pathway. DHS, deoxyhypusine synthase; DOHH, deoxyhypusine hydroxylase; eIF5A, eukaryotic translation initiation factor 5A-1. b, Representative immunoblot of hypusinated eIF5A (eIF5AH) levels in yeast GFP-Atg8 WT and ∆spe1 after 6 h of −N. c, Quantification of b. n = 8(WT), 7(∆spe1) biologically independent samples (yeast cultures). d, Representative maximum projection images of confocal microscopy images of female w1118 fly central brain regions probed for eIF5A and hypusine by immunofluorescence. Before dissection, the flies were fasted for 0 h (ad lib) or 12 h, starting at 20:00. Scale bar, 50 µm. e, Quantification of signal intensities in d. n = 22 (ad lib), 23 (fasted) fly brains. f, Immunoblots of 48 h fasted C. elegans assessed for hypusine and GAPDH. g, Quantification of f. n = 4 biologically independent samples (worm lysates). h, Representative immunoblot of eIF5AH, eIF5A and GAPDH signals of liver samples from ad lib and fasted (14–16 h) young, male C57BL/6 mice. i, Quantification of h. n = 7 mice. j, eIF5AH and total eIF5A levels in human PBMCs after increasing fasting times, measured by capillary immunoblotting. RF, 3 days after re-introduction of food. n = 17 (days 0, 1 and 3), 15 (day 5), 16 (day 7 and RF) volunteers. k, Representative immunoblot of yeast Lia1-6xHA, assessed for HA-tags and GAPDH after 6 and 24 h −N. l, Quantification of Lia1-6xHA levels as depicted in k. n = 8 biologically independent samples (yeast cultures). m, Quantification of relative mRNA expression of dhps-1, dohh-1 and iff-1 in 24 h fasted C. elegans. n = 3 (iff-1), 5 (dhps-1 and dohh-1) biologically independent experiments. n, Quantification of relative mRNA expression of DHPS, DOHH and EIF5A in 6 h starved U2OS cells. n = 3 (DOHH), 4 (DHPS and EIF5A) biologically independent experiments. o, PI-negative (live) yeast cells during chronological lifespan analysis of WT and ∆lia1 yeast in control and −N medium. n = 12 biologically independent samples (yeast cultures). p, Lifespan of C. elegans N2 fed control (CTL) or dhps-1(RNAi) (homologue of DHS) expressing bacteria during IF48:48. Note that the experiments and statistics were performed together with the groups depicted in Fig. 4g,i. n = 913 (CTL ad lib), 750 (CTL IF), 862 (dhps-1(RNAi) ad lib), 776 (dhps-1(RNAi) IF) worms. Statistics used were two-way ANOVA with Holm-Šídák’s multiple comparisons test (c,j,l,o), two-tailed Student’s t-tests with Holm-Šídák’s multiple comparisons test (e,i,m,n), two-tailed Student’s t-test (h) and log-rank test with Bonferroni correction (p). Bar and line graphs show the mean ± s.e.m. Source numerical data and unprocessed blots are available in source data.

