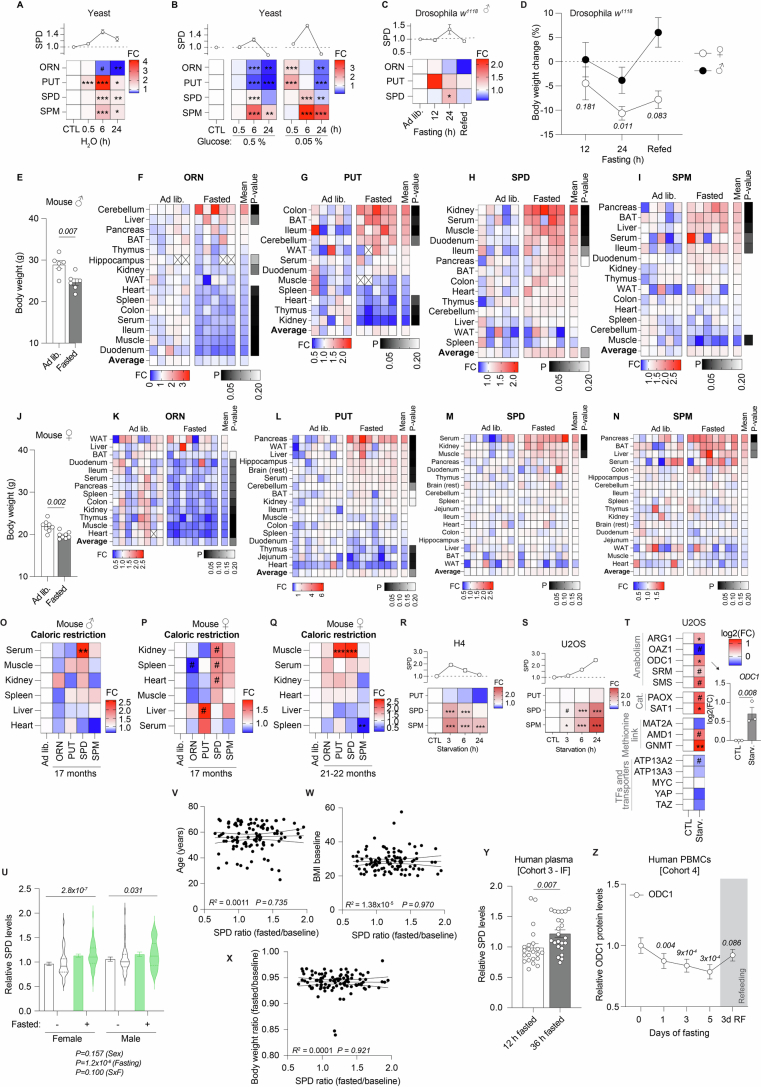
Extended Data Fig. 1. Changes in polyamine levels in starving organisms.
(a) Polyamine levels of WT BY4741 yeast shifted to water for the indicated times. Data normalized to the mean of the control group at every time point. N = 5 biologically independent samples (yeast cultures). (b) Polyamine levels of glucose-restricted WT BY4741 after the indicated times. Data normalized to the mean of the control group at every time point. N = 5 biologically independent samples (yeast cultures). (c) Polyamine levels of young male w1118 flies fasted for 12 or 24 hours (starting at 20:00). Data normalized to the ad libitum group at every time point. Refed = 12 hours refeeding after 24 hours of fasting. N = 7 biologically independent samples (groups of flies). (d) Changes in body weight of young female and male w1118 flies fasted or kept ad lib for the indicated times, starting at 20:00. Data normalized to each ad lib group. P values against each sex’s ad lib group. Refed = 12 hours refeeding after 24 hours of fasting. N = 5(Refed female fasted), 6(24 h female ad lib; Refed female ad lib; Refed male ad lib), 7(12 h, 24 h female fasted; 12 h, 24 h male; Refed male fasted) biologically independent samples (groups of flies). (e) Changes in body weight of young male C57BL/6 mice fasted or kept ad lib for 14-16 hours overnight. N = 6 mice. (f-i) Relative polyamine levels of young male C57BL/6 mice fasted or kept ad lib for 14-16 hours overnight. BAT = brown adipose tissue, WAT = white adipose tissue. FC = fold change to means of ad lib N = 3(ORN Hippocampus; PUT Muscle fasted), 4(PUT WAT fasted), 5(rest) mice. (j) Changes in body weight of young female C57BL/6 mice fasted or kept ad lib for 14-16 hours overnight. N = 8 mice. (k-n) Relative polyamine levels of young female C57BL/6 mice fasted or kept ad lib for 14-16 hours overnight. BAT = brown adipose tissue, WAT = white adipose tissue. FC = fold change to means of ad lib. N = 7(ORN Heart ad lib), 8(rest) mice. (o-q) Relative polyamine levels of male and female C57BL/6 mice kept ad lib or calorie-restricted (30 %), starting at 9 months of age, until the age of 17 or 21 months. (o) N = 4(Fasted Spleen), 6(Fasted Kidney, Serum, Heart; SPM Fasted Liver), 7(Ad lib Spleen; Fasted Muscle, Liver rest), 8(Ad lib Kidney, Liver), 10(Ad lib Serum), 11(Ad lib Heart, Muscle) mice. (p) N = 3(CR Serum SPM), 4(CR Liver, Serum rest), 5(CR Kidney, Spleen), 6(Ad lib Serum; CR Heart, Muscle), 7(), 8(Ad lib Liver, Muscle), 9(Ad lib Kidney, Heart, Spleen) mice. (q)N = 3(Ad lib Liver), 4(Ad lib Kidney, Spleen), 6(Ad lib Serum, Heart, Muscle; CR Kidney, Spleen), 7(CR Heart, Muscle), 8(CR Liver, Serum) mice. (r-s) Polyamine levels in HBSS-starved human U2OS and H4 cells. N = 4 biologically independent samples. (t) Relative mRNA expression levels of polyamine-relevant genes in 6 hours starved U2OS cells. N = 3(ARG1, OAZ1, ODC1, SAT1, ATP13A2, ATP13A3, MYC, YAP, TAZ), 4(SRM, SMS, PAOX, MAT2A, AMD1, GNMT) biologically independent samples. (u) Serum SPD levels after fasting in cohort 1, stratified by sex, depicted as mean with S.E.M and violin plots, showing median and quartiles as lines. N = 67(female), 38(male). (v-x) Serum SPD levels after fasting in cohort 1 do not correlate with age, pre-fasting baseline body mass index (BMI) or body weight loss (body weight ratio). N = 99(Body weight ratio), 102(BMI), 105(Age) volunteers. (y) Relative SPD levels in human plasma from cohort 3 during IF. N = 22(12 h), 23(36 h) volunteers. (z) ODC1 protein levels in human PBMCs after increasing fasting times, measured by capillary electrophoresis. Refeeding = day 3 after re-introduction of food. N = 15(5 d), 16(3d RF), 17(rest) volunteers. Statistics: [A-D,R-S,U,Z] Two-way ANOVA with Holm-Šídák’s multiple comparisons test. [E,J,T] Two-tailed Student’s t-tests. [F-I, K-Q] Two-way ANOVA with FDR correction (Two-stage step-up method by Benjamini, Krieger and Yekutieli, Q = 0.05). [Y] Two-tailed Student’s t-test. [V-X] Simple linear regression analysis. Bar and line graphs show the mean ± s.e.m. Heatmaps show means. * P < 0.05, ** P < 0.01, *** P < 0.001, # P < 0.2. Source numerical data are available in source data.

