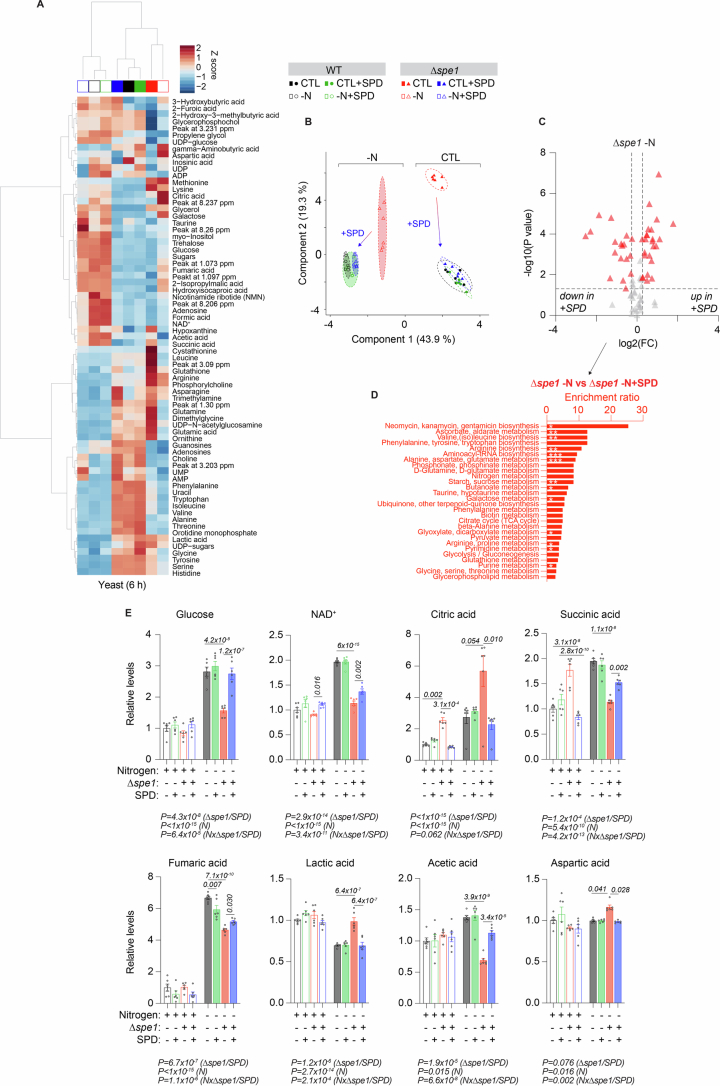
Extended Data Fig. 2. Spermidine supplementation corrects metabolome disturbances in ∆spe1 yeast cells.
(a, b) Heatmap (group means) and PCA of S. cerevisiae WT and ∆spe1 metabolomes after 6 hours -N, with or without 100 µM SPD. Unassigned NMR signals are labelled according to their NMR chemical shift. N = 6 biologically independent samples (yeast cultures). (c) Volcano plot showing significantly different metabolites in ∆spe1 after 6 hours -N, with or without 100 µM SPD. Two-tailed Student’s t-tests with FDR-corrected P values < 0.05, FC (fold change) >1.2. N = 6 biologically independent samples (yeast cultures). (d) Metabolite set enrichment analysis based on KEGG pathways of significantly different metabolites from [C] (raw P-values < 0.2). (e) Selected metabolites from [A], focusing on amino acid metabolism and the TCA cycle. N = 6 biologically independent samples (yeast cultures). Statistics: [E] Two-way ANOVA with Holm-Šídák’s multiple comparisons test. Bar graphs show the mean ± S.E.M. Asterisks indicate raw P-values. *<0.05, **<0.01, ***<0.001. Source numerical data are available in source data.

