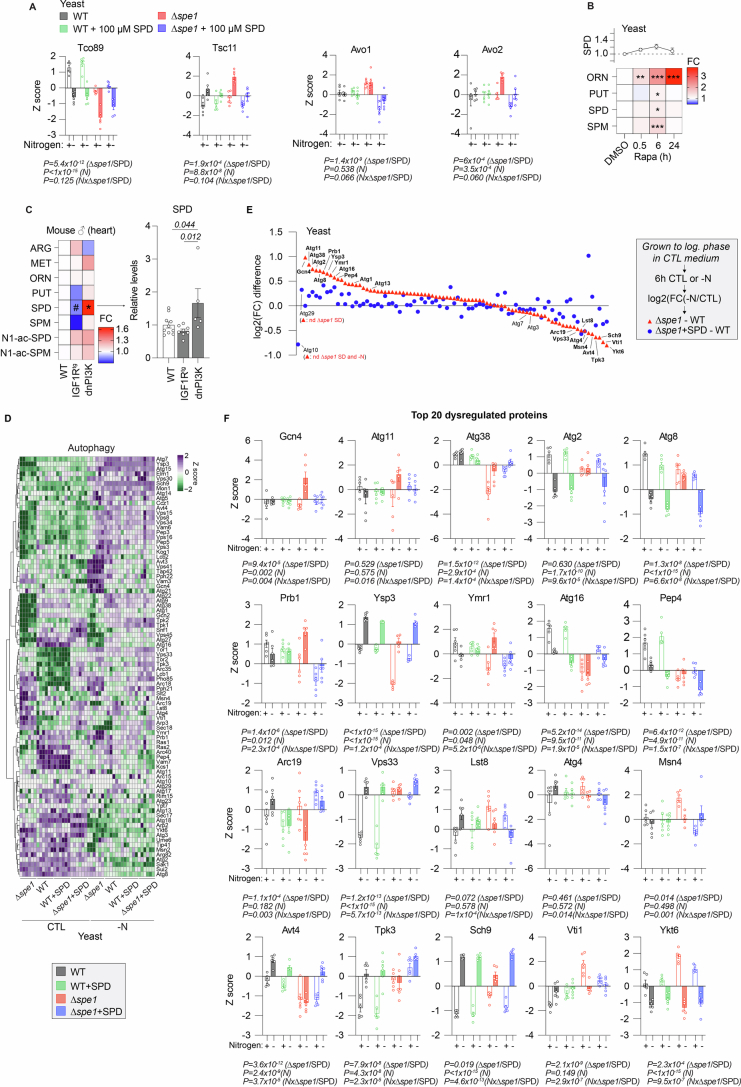
Extended Data Fig. 3. Spermidine is required for the correct shutdown of TORC1 and autophagy regulation in N-starving yeast.
(a) Proteome change in S. cerevisiae WT BY4741 and Δspe1 strains under specified condition treatments following a 6-hour culture in control or -N media with or without 100 µM SPD supplementation. Differential expression (Z-score) of proteins involved in the TORC complex, from the proteome analysis. N = 6 biologically independent samples (yeast cultures). (b) Polyamine levels of WT BY472 treated with rapamycin (40 nM) for the indicated times. Data normalized to the mean of the DMSO control group at every time point. N = 5 biologically independent samples (yeast cultures). (c) Polyamine and precursor levels in cardiac tissue of young, male control, transgenic IGF1tg or dnPI3K mice. N = 5(WT), 8(IGF1Rtg), 11(dnPI3K) mice. (d) Yeast WT and Δspe1 strains under specified condition treatments following a 6-hour culture in control or -N media with or without 100 µM SPD. Differential expression (Z-Score) of proteins involved in autophagy, from the proteome analysis in Supplementary Fig. 1c. N = 6 biologically independent samples (yeast cultures). (e) Differential regulation of autophagy-relevant proteins in ∆spe1 cells. The averaged log2-transformed fold change (FC) of individual proteins (-N compared to control medium) was calculated for all conditions. The graph depicts the differences of these log2(FC) between ∆spe1 and WT cells (red triangles), as well as ∆spe1 treated with 100 µM SPD and WT cells (blue dots). nd=not detected. N = 6 biologically independent samples (yeast cultures). (f) Z-scores of the top 20 dysregulated proteins, as identified in [E]. N = 6 biologically independent samples (yeast cultures). Statistics: [A,B,F] Two-way ANOVA with Holm-Šídák’s multiple comparisons test. [C] Two-way ANOVA with FDR correction (Two-stage step-up method by Benjamini, Krieger and Yekutieli, Q = 0.05). Heatmaps show means. Bar and line graphs show the mean ± s.e.m. * P < 0.05, ** P < 0.01, *** P < 0.001, # P < 0.2. Source numerical data are available in source data.

