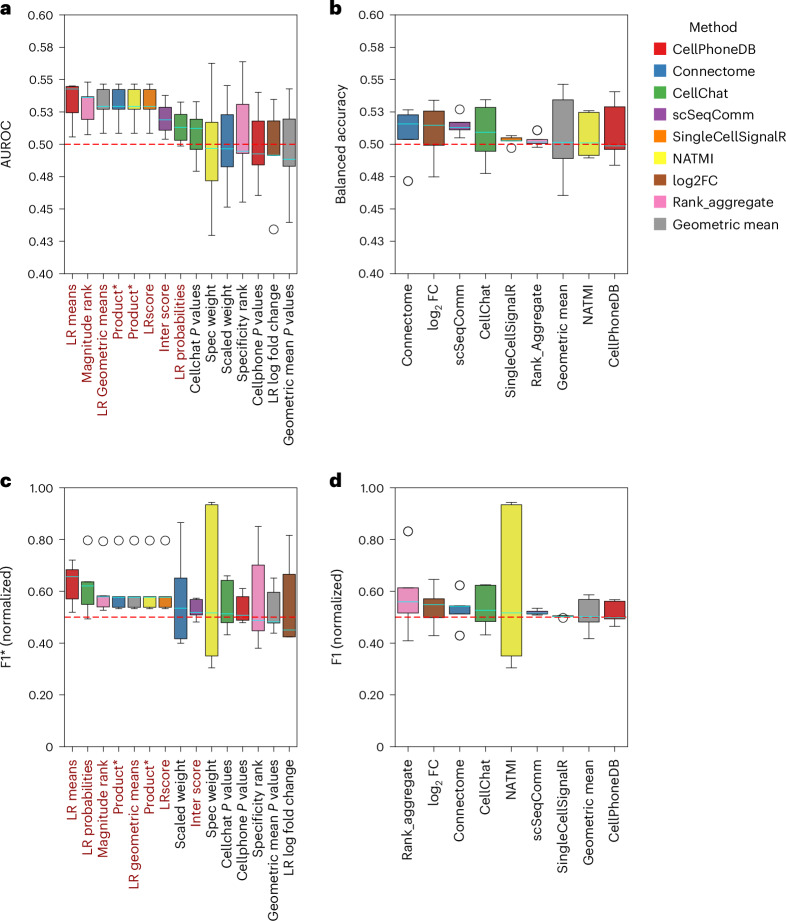
Fig. 4. Comparison of ligand–receptor inference methods using the spatial co-localization of cell types and ligand–receptors as assumed truth.
Each method, as re-implemented in LIANA+, and its individual ligand-receptor (LR) scoring functions are represented by a different box colour. Scoring functions that reflect the magnitude strength of an interaction are shown in dark red, while those that capture cell-type specificity in black. a, Quantification of the performance of each method’s scoring functions using the AUROC. b, The balanced accuracy for each of the methods filtered according to their suggested false positive filtering thresholds. c,d, The normalized F1 scores following filtering for each score (*) (c) and method (d). For each metric, a score of 0.5, denoted by the dashed red line, indicates random performance. Note that while we show 0 to 1 for normalized F1, unlike balanced accuracy and AUROC, it is bound between negative and positive infinity (Methods). Both NATMI and Connectome use expression products (Product*) as a measure of magnitude strength. The boxes were ordered according to the median performance across datasets (central line in cyan within each box; n = 5 datasets). The box hinges represent the first and third quartiles, and the whiskers extend up to 1.5 times the interquartile range above and below the box hinges. Outliers are depicted as individual hollow points beyond the whiskers. Source numerical data are available in source data.

