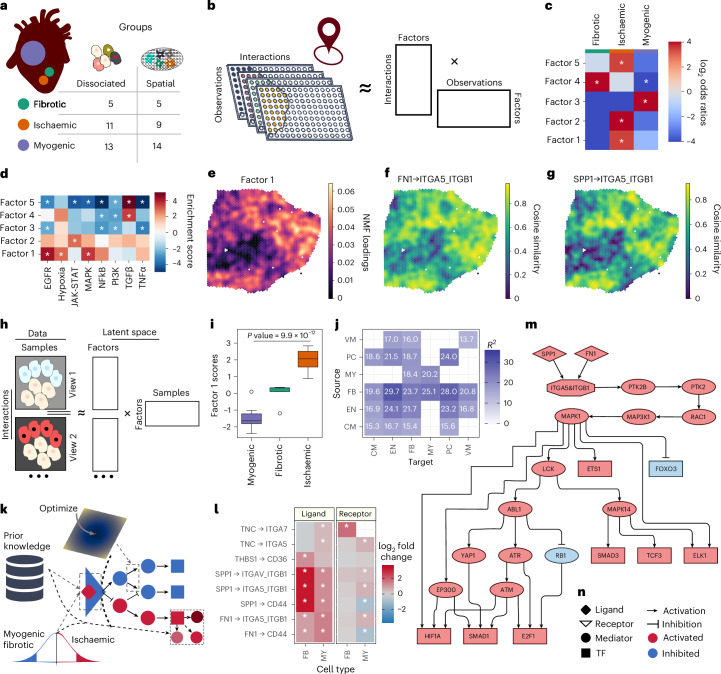
Fig. 5. LIANA+ models intercellular communication from dissociated and spatially resolved transcriptomics data.
a, Sampling sites from human myocardial infarction patients. b, Overview of NMF applied to local interactions inferred for each location/observation across all slides. c, log2-transformed odds ratios and Fisher’s exact test P values representing the enrichment or depletion of fibrotic, ischaemic and myogenic labels in each of the factors inferred by NMF. d, Pathway enrichment50 of NMF ligand–receptor loadings. Asterisks indicate FDR-corrected P values <0.05, with the colour map distinguishing between positive (red) and negative (blue) enrichment. e, NMF factor 1 scores per observation in an ischaemic tissue section. f,g, Spatially weighted cosine similarity of FN1 (f) and SPP1 (g) with the ITGA5 and ITGB1 complex, respectively, in a selected (ACH0014) sample. h, The procedure to decompose ligand–receptor interactions inferred between cell types from dissociated single-nucleus data samples into factors and corresponding feature sets. i, Multi-view factor scores following ligand–receptor score decomposition with one-way analysis of variance P value across ischaemic, fibrotic and myogenic samples (n = 29). The central line within each box marks the median, with the box hinges representing the first and third quartiles. The whiskers extend up to 1.5 times the interquartile range above and below the box hinges. Outliers are depicted as individual hollow points. j, Multi-view factorization factor 1 variance explained across cell-type pairs (views). Abbreviations include cardiomyocytes (CM), endothelial cells (EN), FB, MY, pericytes (PC) and vascular smooth muscle cells (VM). k, To link deregulated inter- and intracellular signalling events, we combine ligand–receptor prior knowledge with differential contrast statistics between ischaemic samples versus the rest. Then, using knowledge of intracellular protein–protein interactions and TF regulons, we identify sign-coherent subnetworks that connect intercellular interactions (start nodes) with deregulated TFs (end nodes; Methods). l, A subset of interactions, the ligand and/or receptors of which are known to play a role in fibrosis27,53,55 and were deregulated in FB and/or MY types. Only interactions with the highest loadings (>95th percentile) from the NMF analysis on spatially informed local ligand–receptor interactions were included in the differential expression analysis. Asterisks signify genes with FDR <0.05, and the colour bar corresponds to log2FC47,48. m, Sign-coherent signalling network originating from FN1 and SPP1 and propagating down to TFs deregulated in MY in ischaemia. n, Corresponding legend for the network in m. Source numerical data are available in source data.

