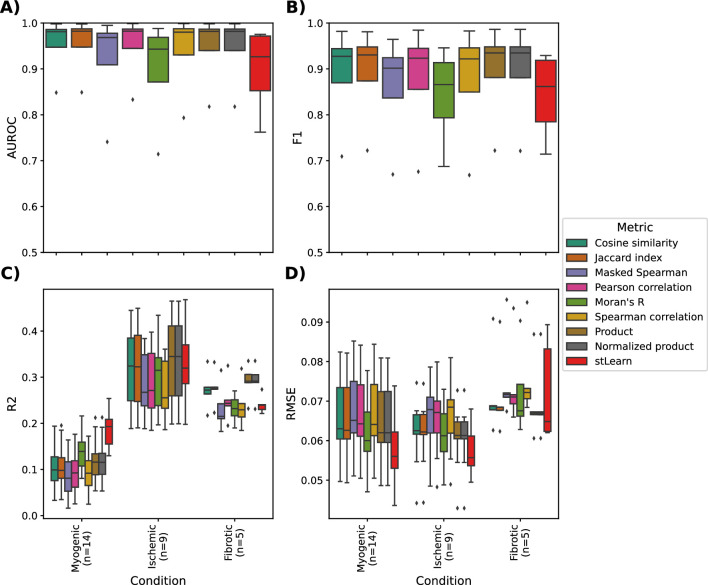
Extended Data Fig. 2. Spot-calling evaluations show that the local metrics in LIANA+ perform well at preserving biological information.
A) AUROC and B) weighted F1 when using local metrics to classify malignant spots in breast cancer spatial transcriptomics data (n = 4 samples)76; C) R2 and D) RMSE when using local metrics to predict cell type proportions in heart spatial transcriptomics data27. The line in the boxplots represents the median with hinges showing the first and third quartiles and the whiskers extend up to 1.5 times the interquartile range above and below the box hinges. Outliers are shown as diamonds. Source numerical data are available in source data.

